
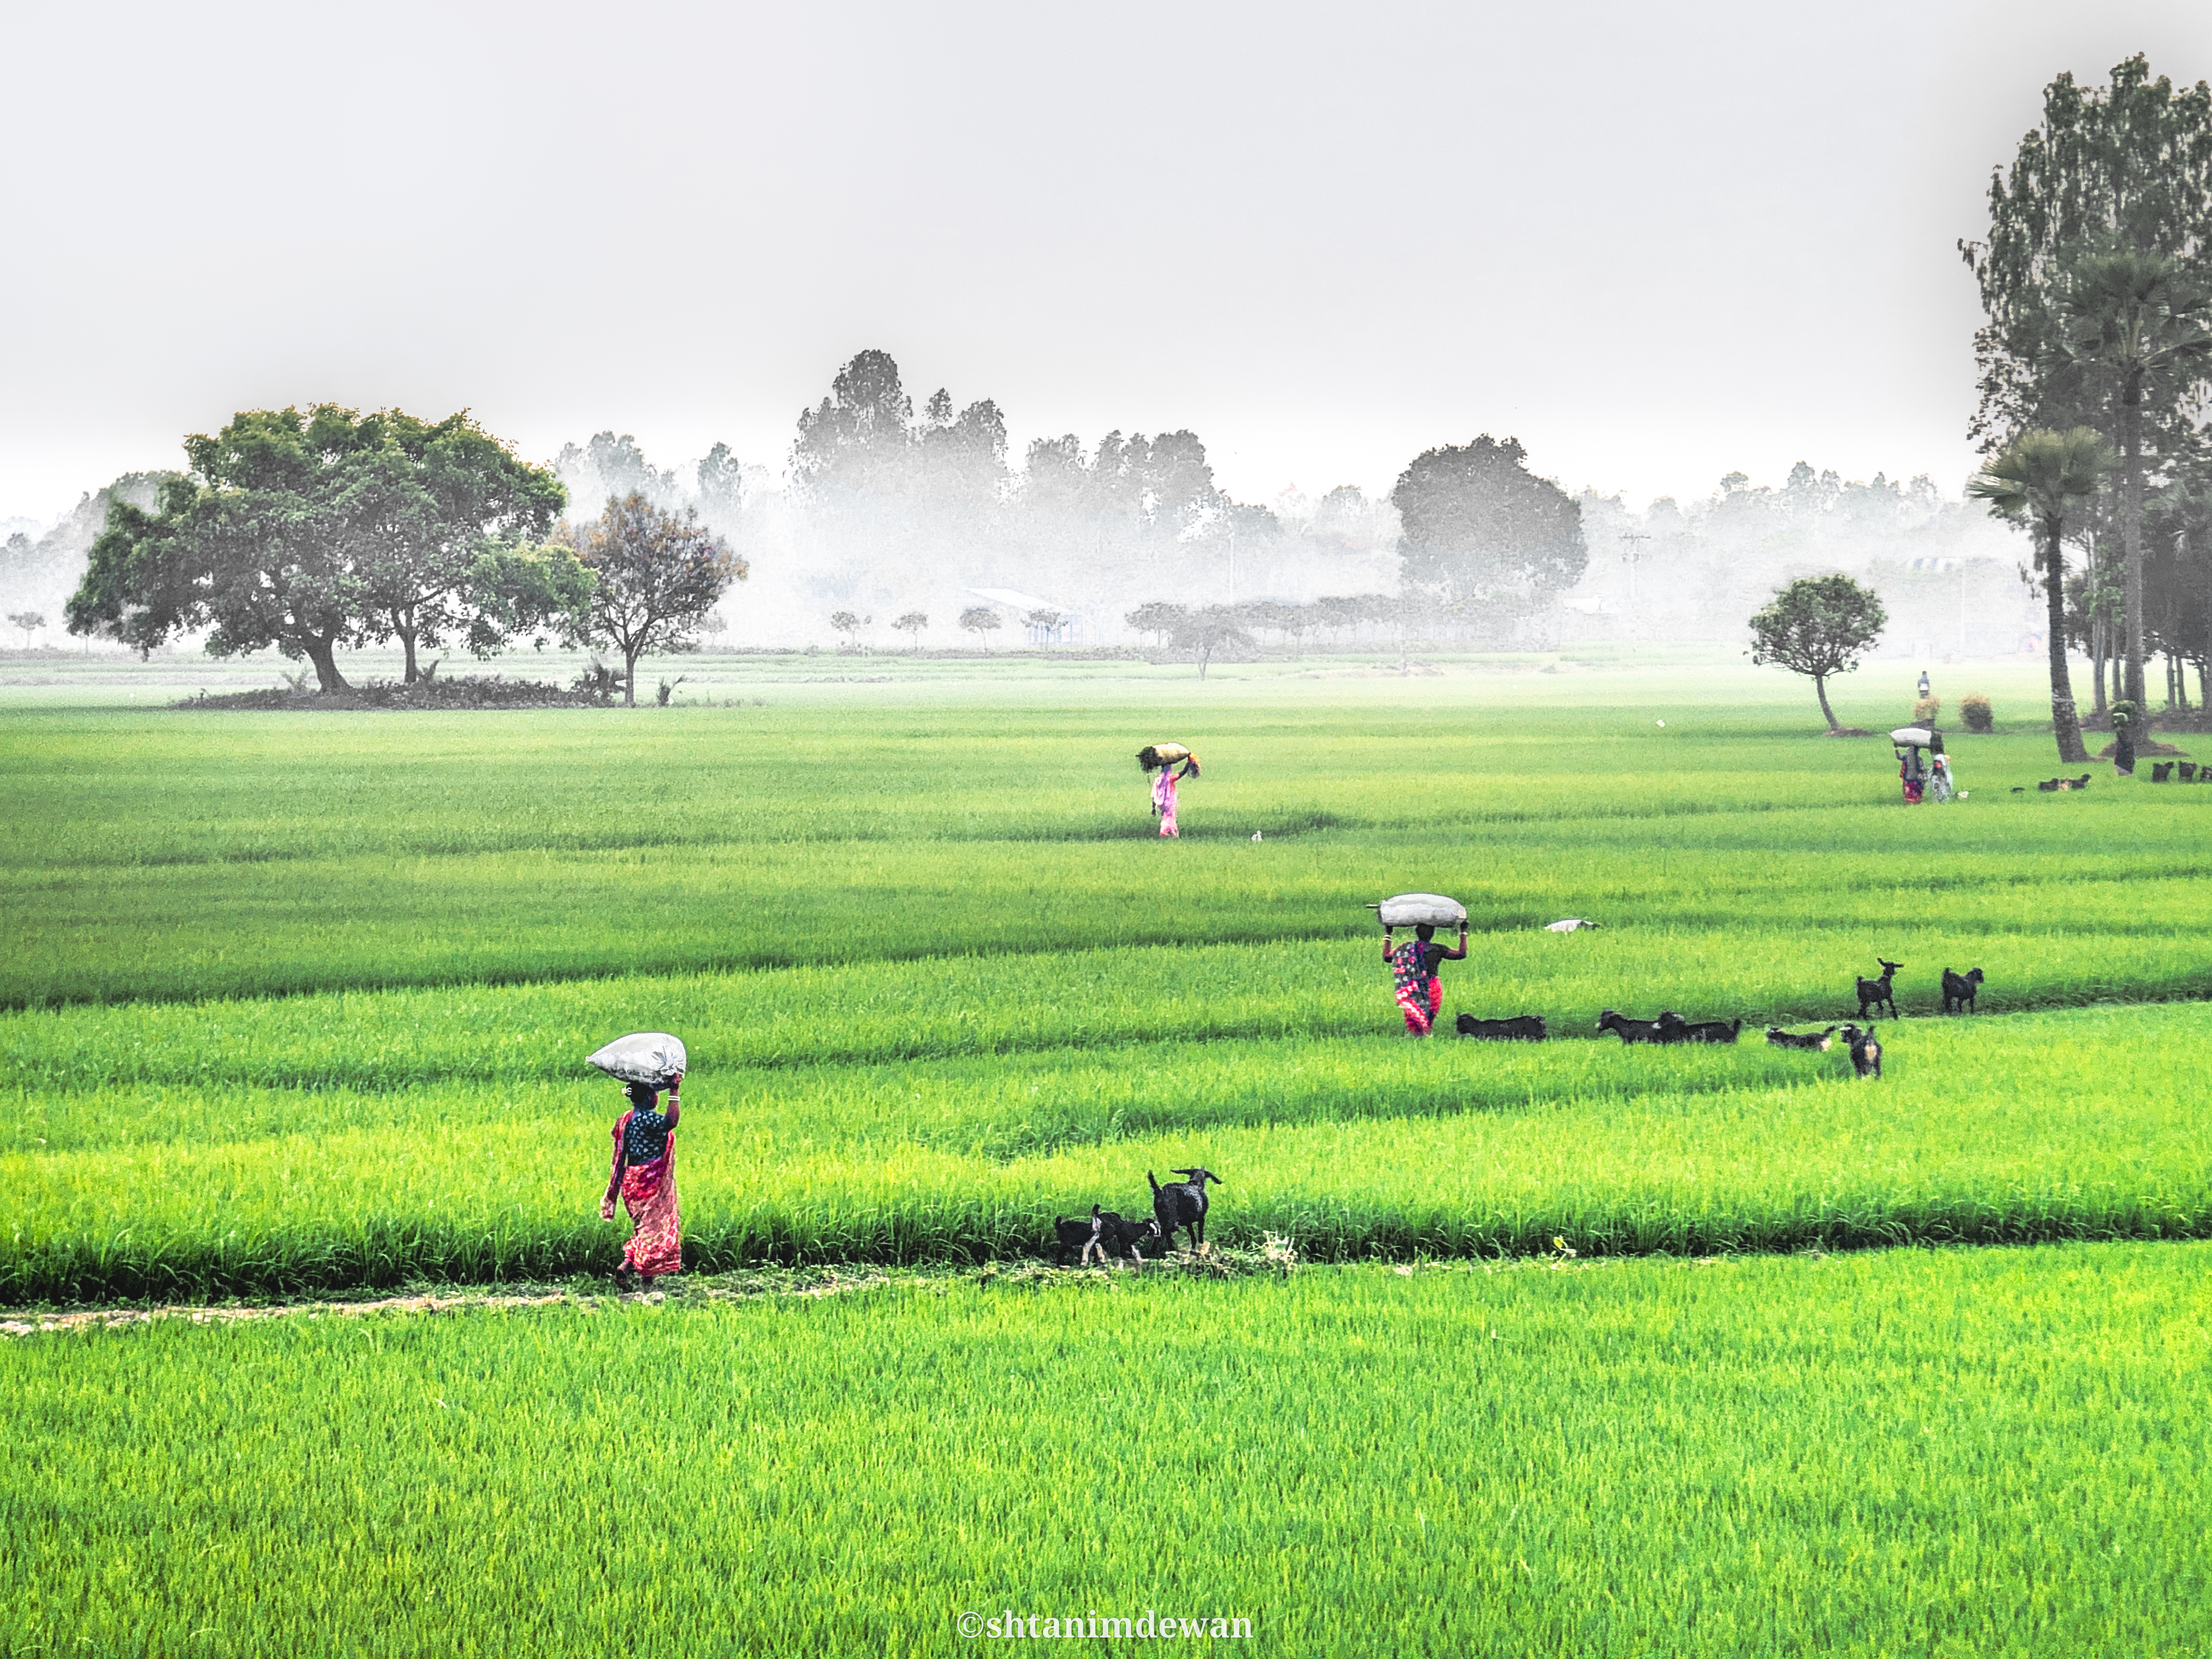
In the far northwest of Bangladesh, where the raised ground of the Barind Tract begins to fall away towards lower country, there is a band of land that cannot be read from its surface alone. A traveller passing through western Naogaon or the northern edge of Chapainawabganj sees what looks like ordinary rice land, flat fields, earthen ridges, a slow river, and the occasional wide depression that fills and empties with the seasons. Yet to judge how a single field here will behave, when it can be ploughed, what it can grow, how long it will stay under water once the monsoon passes, a farmer needs to know far more than the colour of the soil. They have to know how low the land lies, how water arrives and drains away, and how quickly the ground firms up after the rains retreat.
This is the Lower Purnabhaba Floodplain, recorded in Bangladesh's agricultural geography as Agro-Ecological Zone 06, or AEZ-06. (Some publications spell the river Punarbhaba or Punarbhava; this feature uses Purnabhaba throughout.) It is one of the country's smaller agro-ecological zones, set into the extreme western part of Naogaon District and reaching up into the north of Chapainawabganj. Measured against Bangladesh's great river plains it covers very little ground. But its mixture of heavy clay, acidic soils, shallow basins and seasonal flooding makes it an unusually instructive piece of country for anyone trying to understand how soil, water and farming fit together.
Government land-resource records and the Bangladesh Delta Plan 2100 describe AEZ-06 as a landscape of low basins and wetlands, known locally as *beels*, separated by slightly higher floodplain ridges. In an average monsoon, broad areas can sit under deep water, while the adjoining High Barind Tract sheds run-off down into the lower ground and the Purnabhaba River can push flood water back across the plain. The single most important point to carry into this landscape is also the plainest to state and the hardest to act on: even within one agro-ecological zone, no two fields are guaranteed to share the same soil, the same water or the same growing conditions.
A landscape shaped by rivers, ridges and basins
The Lower Purnabhaba Floodplain takes its character from the lower course of the Purnabhaba River. Its surface is a patchwork of broad, low-lying basins, low floodplain ridges that rise only slightly above them, and beels that occupy the deepest parts of the basin floors. These are not dramatic landforms. The difference in height between a ridge that drains early and a basin that holds water for weeks may be no more than a stride, and yet that small difference governs almost everything a farmer can do.
Water in such a place does not come from a single direction. During heavy rain, run-off slides down from the higher Barind land into the basins. If the river rises at the same time, the water already sitting in the low ground has nowhere to go, and local flooding deepens. The Delta Plan 2100 identifies both deep seasonal flooding and flash-flood risk, the second driven by sudden run-off from the Purnabhaba and the High Barind Tract, as defining hazards of this zone. An FAO land-resources appraisal of the wider Naogaon and Chapainawabganj area reached a similar conclusion for its western side, noting that the lower floodplain is inundated in ordinary years when the rivers overtop their banks.
The practical result is a landscape of fine margins. One field may shed its water within a day or two of the rain stopping; a neighbouring field, only slightly lower, may stay waterlogged for a week or longer. Some land is ready for cultivation early in the season; some comes free only after a long wait. Those differences decide planting dates, crop choice, the timing of land preparation and whether a tractor or power-tiller can even enter the plot. A regional map is a useful starting point for understanding all this, but it is only a starting point. The decisions that matter are made field by field.
Where is AEZ-06?
AEZ-06 occupies the extreme western part of Naogaon District and a smaller stretch of northern Chapainawabganj. A soil-mineralogy study published in 2013 put the zone's area at roughly 129 square kilometres. That figure is worth treating with care rather than repeating as a fixed truth: mapped area depends on the boundary version and the measurement method used, and it should be checked against the latest official GIS dataset before being presented as definitive.
It also helps to understand what an agro-ecological boundary is, and what it is not. It does not follow a single river, a particular beel or the administrative edge of a district. Agro-ecological zones are drawn from a combination of landform, soil, hydrology and related environmental features. For that reason a district name on its own tells us very little about the soil beneath a given field or the flood risk it faces. Two plots in the same union can differ in elevation, in soil texture and in how well they drain. The boundary on the map and the reality underfoot are related, but they are not the same thing, and in a zone as varied as this one, the gap between them is exactly where a farmer's success or failure is decided.
Heavy clay: a resource and a management challenge
Heavy clay is the defining feature of AEZ-06. Government land-resource descriptions characterise the soils as dark grey, mottled with red and very strongly acidic, with organic matter in the medium-to-high range and overall fertility around medium. These are not the light, free-draining soils of a river's natural levee. They are dense, sticky when wet, hard when dry, and slow to let go of water.
That single property, the ability to hold water, cuts both ways. Under the right conditions it is a genuine asset, because transplanted rice depends on standing water and heavy clay keeps a field wet when lighter soils would have drained. But the same trait becomes a liability the moment there is too much water, or water at the wrong time. A field that stays saturated takes longer to dry; land preparation is delayed; machinery struggles to work ground that behaves like putty; and the window for establishing the next crop narrows. On these soils the calendar is set as much by how fast the land will dry as by when the farmer would like to plant.
Soil acidity adds a second layer of complexity. In strongly acidic soils some nutrients become less available to plants, while certain elements can become available in amounts high enough to risk harming a crop. But acidity is not a single problem with a single answer. The actual effect depends on the particular soil, the crop, the balance of nutrients and the way the land is managed. Not every acidic field behaves the same way, and not every field needs the same correction. This is why a blanket fertiliser or lime recommendation drawn from a regional average is a poor guide. Where reliable soil-test results exist, they should lead. Where testing is not possible, existing government soil information can give a starting direction, but it has to be read alongside the field's own history and the conditions a farmer can see and feel.
The history hidden beneath the soil
One of the more striking research findings from AEZ-06 has nothing to do with the surface at all. It concerns where the soil came from. For many years the region's clays were assumed to be linked closely to Teesta (Tista) alluvium, the sediment laid down by one of the region's major rivers. Researchers set out to test that assumption by looking not only at the topsoil but at the deeper layers beneath it.
A study published in 2013 in the bulletin of the Institute of Tropical Agriculture at Kyushu University analysed samples taken from several depths across six soil profiles in the zone. The clay content was high throughout, running from about 31 to 54 per cent, and most samples were classed as silty clay. When the researchers examined the fine clay fraction, they found it dominated by mica, together with interstratified mica-vermiculite-smectite and kaolinite-smectite minerals. Crucially, the deeper layers in most profiles pointed to Madhupur Clay, the old, weathered terrace material of the Barind, as the dominant influence, with only a limited contribution from Teesta alluvium. One layer in a single profile ran against the trend and showed a stronger Teesta signature.
The finding illustrates a principle that runs through all good soil science: a long-held assumption can be refined, or even overturned, once better evidence arrives. It carries a practical lesson as well. Clay minerals shape how a soil holds and releases both water and nutrients, and the minerals near the surface are not always a reliable guide to those deeper down. A single sample scraped from the top of a field cannot be relied on to describe the whole profile, a caution that matters most precisely where heavy clay, acidity and seasonal waterlogging act on one another, as they do here.
Why differences between fields matter
An earlier study, published in 2007, examined the chemical properties of soils across AEZ-06 and the neighbouring zone, including soils of the Jaonia series. The researchers measured texture, acidity, organic carbon, total nitrogen, phosphorus, sulphur and a range of exchangeable nutrients. They described the zone's soils as dark grey, mottled red, very strongly acidic heavy clays, found on both the ridge sites and the basin sites, and marked by fine textures and a high clay content.
Work of this kind makes a point that is easy to forget in the field: soil cannot be described adequately by its colour or its feel alone. Two plots that look alike can differ in the nutrients they hold, in their organic matter and in other properties that decide how a crop will perform. For a farmer, that means fertiliser decisions should follow the crop's requirements, the field's condition and the best available evidence, rather than a habit applied uniformly across every plot. For a researcher, it means that assigning one soil value to an entire village or union risks erasing the very differences that explain why one field yields well and another, close by, disappoints.
The seasonal rhythm of farming
In AEZ-06 the low ground, the beels and the heavy clay make the timing of water the central question of the farming year. The onset of the monsoon, the peak of the flood, the moment the water begins to drain and the amount left available through the dry season all bear on what can be grown and when the land can be worked. Naogaon as a whole is one of Bangladesh's leading rice districts, growing the *aus*, *aman* and *boro* crops across the year; but it would be misleading to assume that every field in this small western zone follows one calendar or one cropping pattern. Suitability depends on elevation, on the depth and duration of flooding, on access to irrigation, on the state of the soil and, not least, on the economic choices a household can afford to make.
Standing water is essential for rice, but prolonged flooding or waterlogging can just as easily cut a yield as support it. For crops other than rice, the priority flips: what matters most is a reliable dry window for field operations and enough drainage to keep roots healthy. A sound account of farming here therefore cannot stop at listing the crops that are grown. It needs to record planting dates, how long water stood on the land, the varieties chosen, how the crop was managed and what it actually yielded. Without that detail, the numbers describe a zone but not a farm.
What satellites can reveal, and what they cannot
Modern satellite imagery offers a powerful way to watch how land and water change across a zone like this. Data from the Landsat and Sentinel-2 programmes can track the spread of open water, the retreat of wetlands, the greening of crops and shifts in land use through the seasons. Vegetation indices such as NDVI give a running measure of how vigorous a crop looks, and digital elevation data can separate the slightly higher, earlier-draining fields from the lower ones that hold water. Joined to rainfall and temperature records, these layers can reveal relationships between water conditions and crop performance that no single field visit would show.
But a satellite has clear limits. It can show that the vegetation in a particular field has fallen off, and then fall silent on why. Excess water, a nutrient shortage, disease, pests, a seed problem or a simple change in planting date can all produce a similar signal from above. Satellite observations, in other words, raise good questions; they rarely answer them on their own. To be useful they have to be checked against what is actually happening on the ground and against the records farmers keep. The image and the field have to be read together.
Building a field-level evidence system
Imagine a single village in AEZ-06 with dozens, or hundreds, of separate fields. If the same soil value, the same flood-risk category and the same expected yield are stamped across all of them, the differences that make each field what it is simply vanish from the data. A more honest and more useful record would capture, for each field, its location and elevation, its soil type, pH and organic matter, its nitrogen, phosphorus and potassium, its moisture, the depth and duration of any flooding, the crop variety and planting date, the fertiliser and irrigation applied, the pest and disease events, the production costs, the market price and, finally, the harvest.
No one expects every one of those variables to be collected at once. The discipline that matters is recording where each value came from and how far it can be trusted, whether it was measured directly in the field, drawn from an existing government dataset, estimated from a satellite, or simply missing. This distinction is sharpest for soil nutrients. Satellite imagery does not measure soil nitrogen, phosphorus or potassium directly; those figures require laboratory analysis, reliable existing soil data or a clearly documented method of estimation. An estimate dressed up as a measurement is worse than an honest gap, because it invites confident decisions built on nothing solid.
The role of artificial intelligence
With several years of field-level records behind it, artificial intelligence could become a genuine aid to agricultural research in AEZ-06. Machine-learning models could probe which fields tend to stay waterlogged, how rainfall relates to yield, where production risk is concentrated and under what conditions crops are most likely to fail. By weaving together soil data, elevation, weather and farmers' own records, such models could surface patterns that are difficult to detect by hand.
Building a model, however, does not by itself help a single farmer. A prediction only earns trust once it has been checked against real harvests; a flood-risk estimate only earns trust once it has been tested against observed conditions in the field. When a model gets something wrong, and it will, the task is to understand why and to improve it. Artificial intelligence belongs alongside a farmer's experience and judgement, as a support for evidence-based decisions, not as a replacement for either the farmer or the field.
Research priorities for a small but telling zone
Several lines of work could sharpen our understanding of AEZ-06. The first is to build a long-term agricultural database at the level of villages and individual fields, so that change can be tracked over years rather than guessed at. The second is to examine directly how elevation, soil acidity and the duration of waterlogging relate to one another. The third is to compare existing soil datasets against satellite observations and field records, testing where they agree and where they diverge. The fourth is to study how seasonal flooding affects crop performance and the stability of yields from year to year. The fifth, too often left out, is to bring production costs and farm income into the research itself, so that findings speak to a household's livelihood and not only to its agronomy.
Because AEZ-06 is relatively small, it is well suited to a focused pilot of exactly this kind. Its compactness is an advantage: a modest, carefully designed effort could cover a meaningful share of the zone. But its internal variety is a warning too. Any finding drawn from one set of fields should be tested across different field conditions and different seasons before it is applied to the zone as a whole.
From a map to the farmer's field
The value of agricultural research should not be measured only by the number of papers it produces. It should also be judged by whether it helps farmers make better decisions, manage risk, steady their yields, understand their costs and protect their livelihoods. AEZ-06 is a reminder that even a small agricultural region can be shaped by processes of real complexity, the origin of its soils, the lie of its land, the movement of its water, the balance of its nutrients and the crops that depend on all of them. To understand such a place takes both the regional view the map provides and the field-level evidence only the ground can supply.
The next step is to connect the agro-ecological map with village records, with individual fields and with observations gathered patiently over time; to test research findings under real farming conditions; and to turn what survives that test into advice a farmer can use. The aim is not simply to gather more data. It is to produce reliable evidence, to test better decisions and to measure whether farmers are genuinely better off.
AEZ → Village → Field → Data → Scientific Research → Field Validation → Farmer Adoption → Measurable Impact.
That is how the study of the Lower Purnabhaba Floodplain can move beyond a line on a classification map and become part of the real working life of the people who farm it.
Sources consulted: Bangladesh Delta Plan 2100 (Bangladesh Planning Commission); Banglapedia, "Agro-ecological Zone"; Reza et al. (2013), Bulletin of the Institute of Tropical Agriculture, Kyushu University, on the clay mineralogy of AEZ-06; Alam et al. (2007) on the chemical properties of AEZ-05 and AEZ-06 soils; and an FAO land-resources appraisal covering the Naogaon-Chapainawabganj area. Numerical and boundary figures should be verified against current official datasets before being treated as definitive.
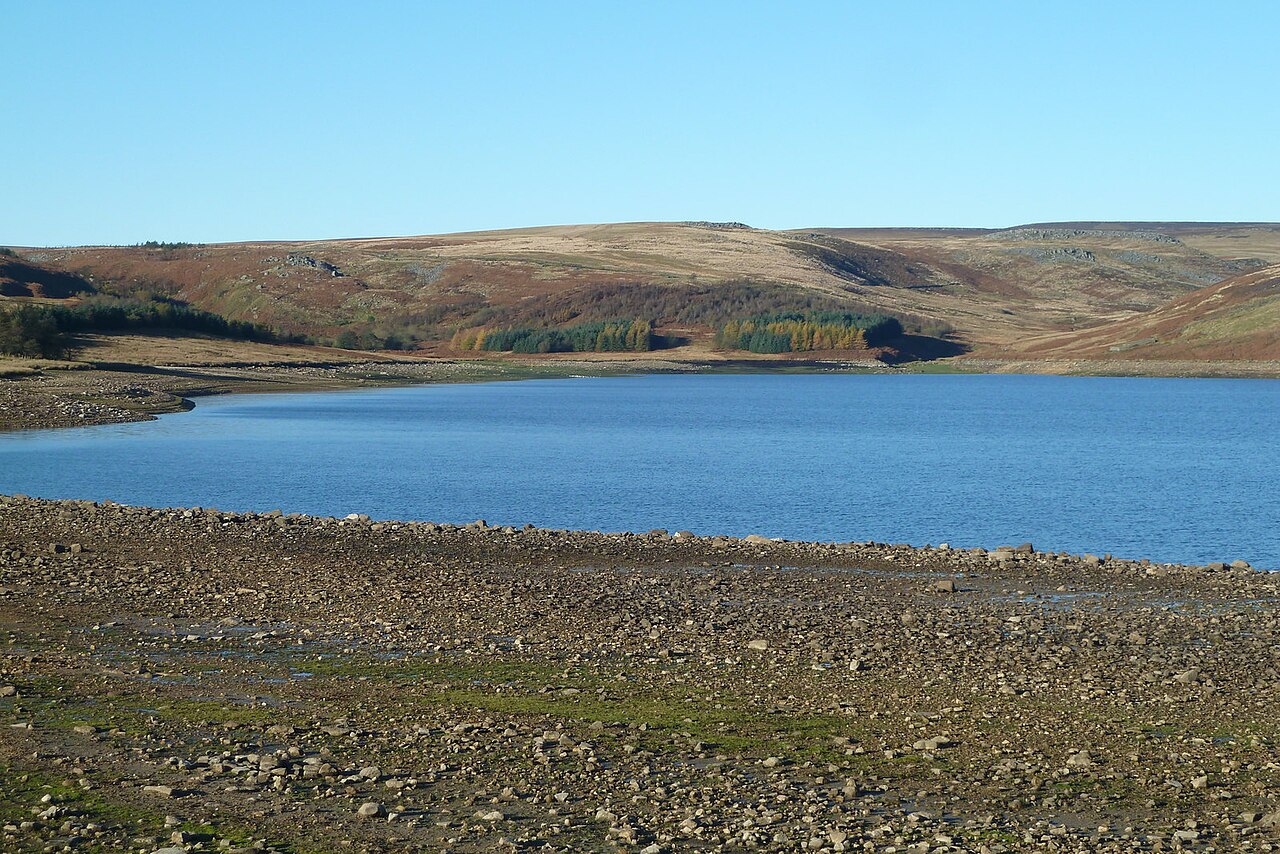
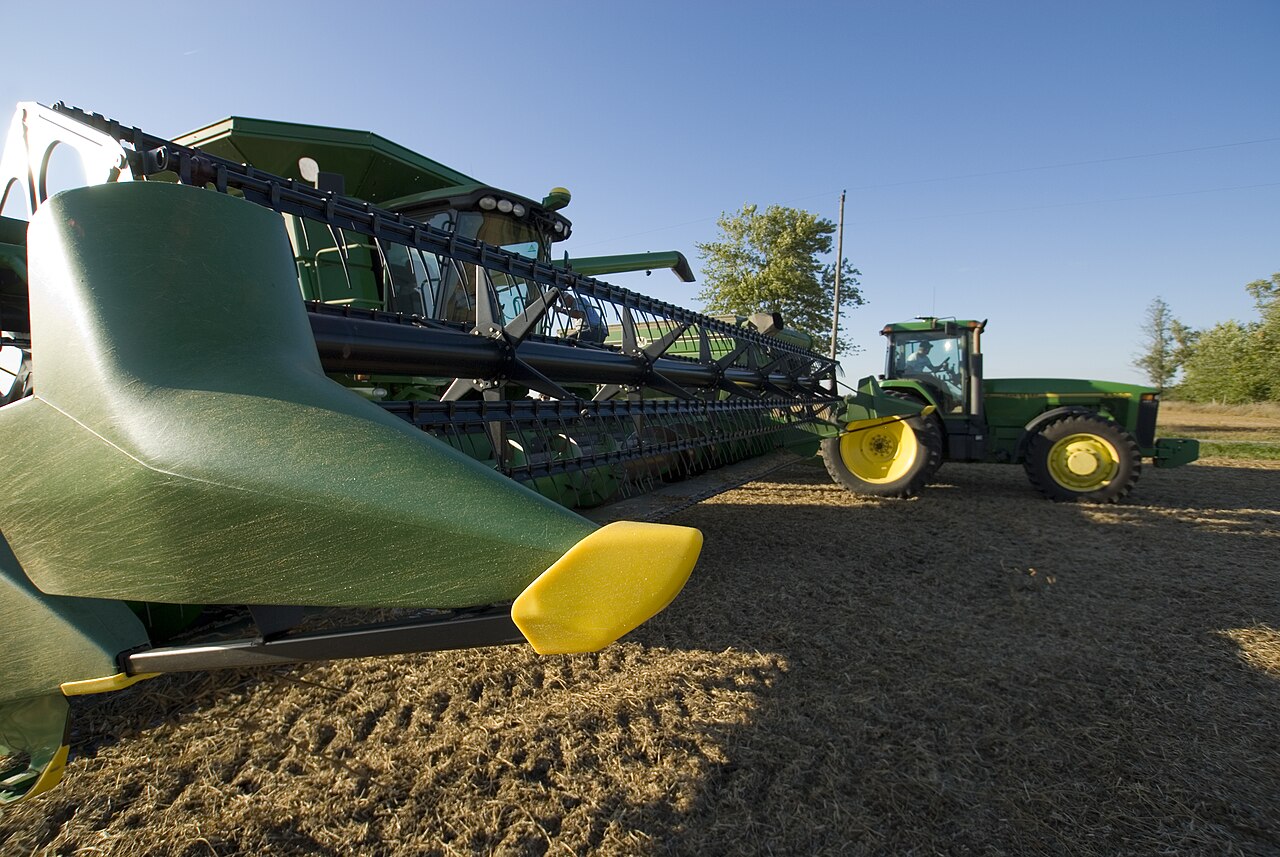
Images: featured photo, paddy fields in Naogaon at dusk by S.H. Tanim / Wikimedia Commons, CC BY-SA 4.0. Also: a river in Naogaon by Sakib454590 (CC BY-SA 4.0); Halti Beel, Natore by Masum-al-Hasan Rocky (CC BY-SA 4.0); field preparation by MdRamjanAliWiki (CC BY 4.0); all via Wikimedia Commons.
Comments
(0)