
The United States Department of Agriculture has started running its monthly crop forecasts past an artificial intelligence tool before they reach the public, a response to a rare data error that skewed September's corn figures for two of the country's biggest farm states and shook confidence in what many traders call the gold standard of agricultural statistics.
Reuters reported on 6 November that USDA would use an AI tool it built in-house to check the Crop Production report due on 10 November. Scott Hutchins, USDA's Under Secretary for Research, Education and Economics, said officials decided to deploy it after testing whether it would have caught the September mistake and concluding that it would. He told Reuters he was "very bullish" on using such tools to avoid future errors. The report came out on schedule on Tuesday, 10 November, and the Red River Farm Network reported on 11 November that the tool had screened it before release.
USDA has described the system as an extra layer of checking, not a replacement for its statisticians. It has not published how the tool works, and reports published by 11 November did not say whether it flagged anything in the November figures. Even so, the move matters beyond the American Midwest, because US crop estimates help set the grain prices that farmers, feed makers and governments around the world plan by.
A file mix-up that moved two states' corn numbers
The trouble began with the Crop Production report released on 11 September 2026. On 23 October the National Agricultural Statistics Service (NASS), the USDA agency that produces the forecasts, posted an update alert saying the September report was being reissued with corrections on five pages. The changes touched the September corn yield and production forecasts for Kansas, Nebraska and the United States, and the plant population and ears-per-acre figures for the two states and for the 10-state region that NASS samples most closely.
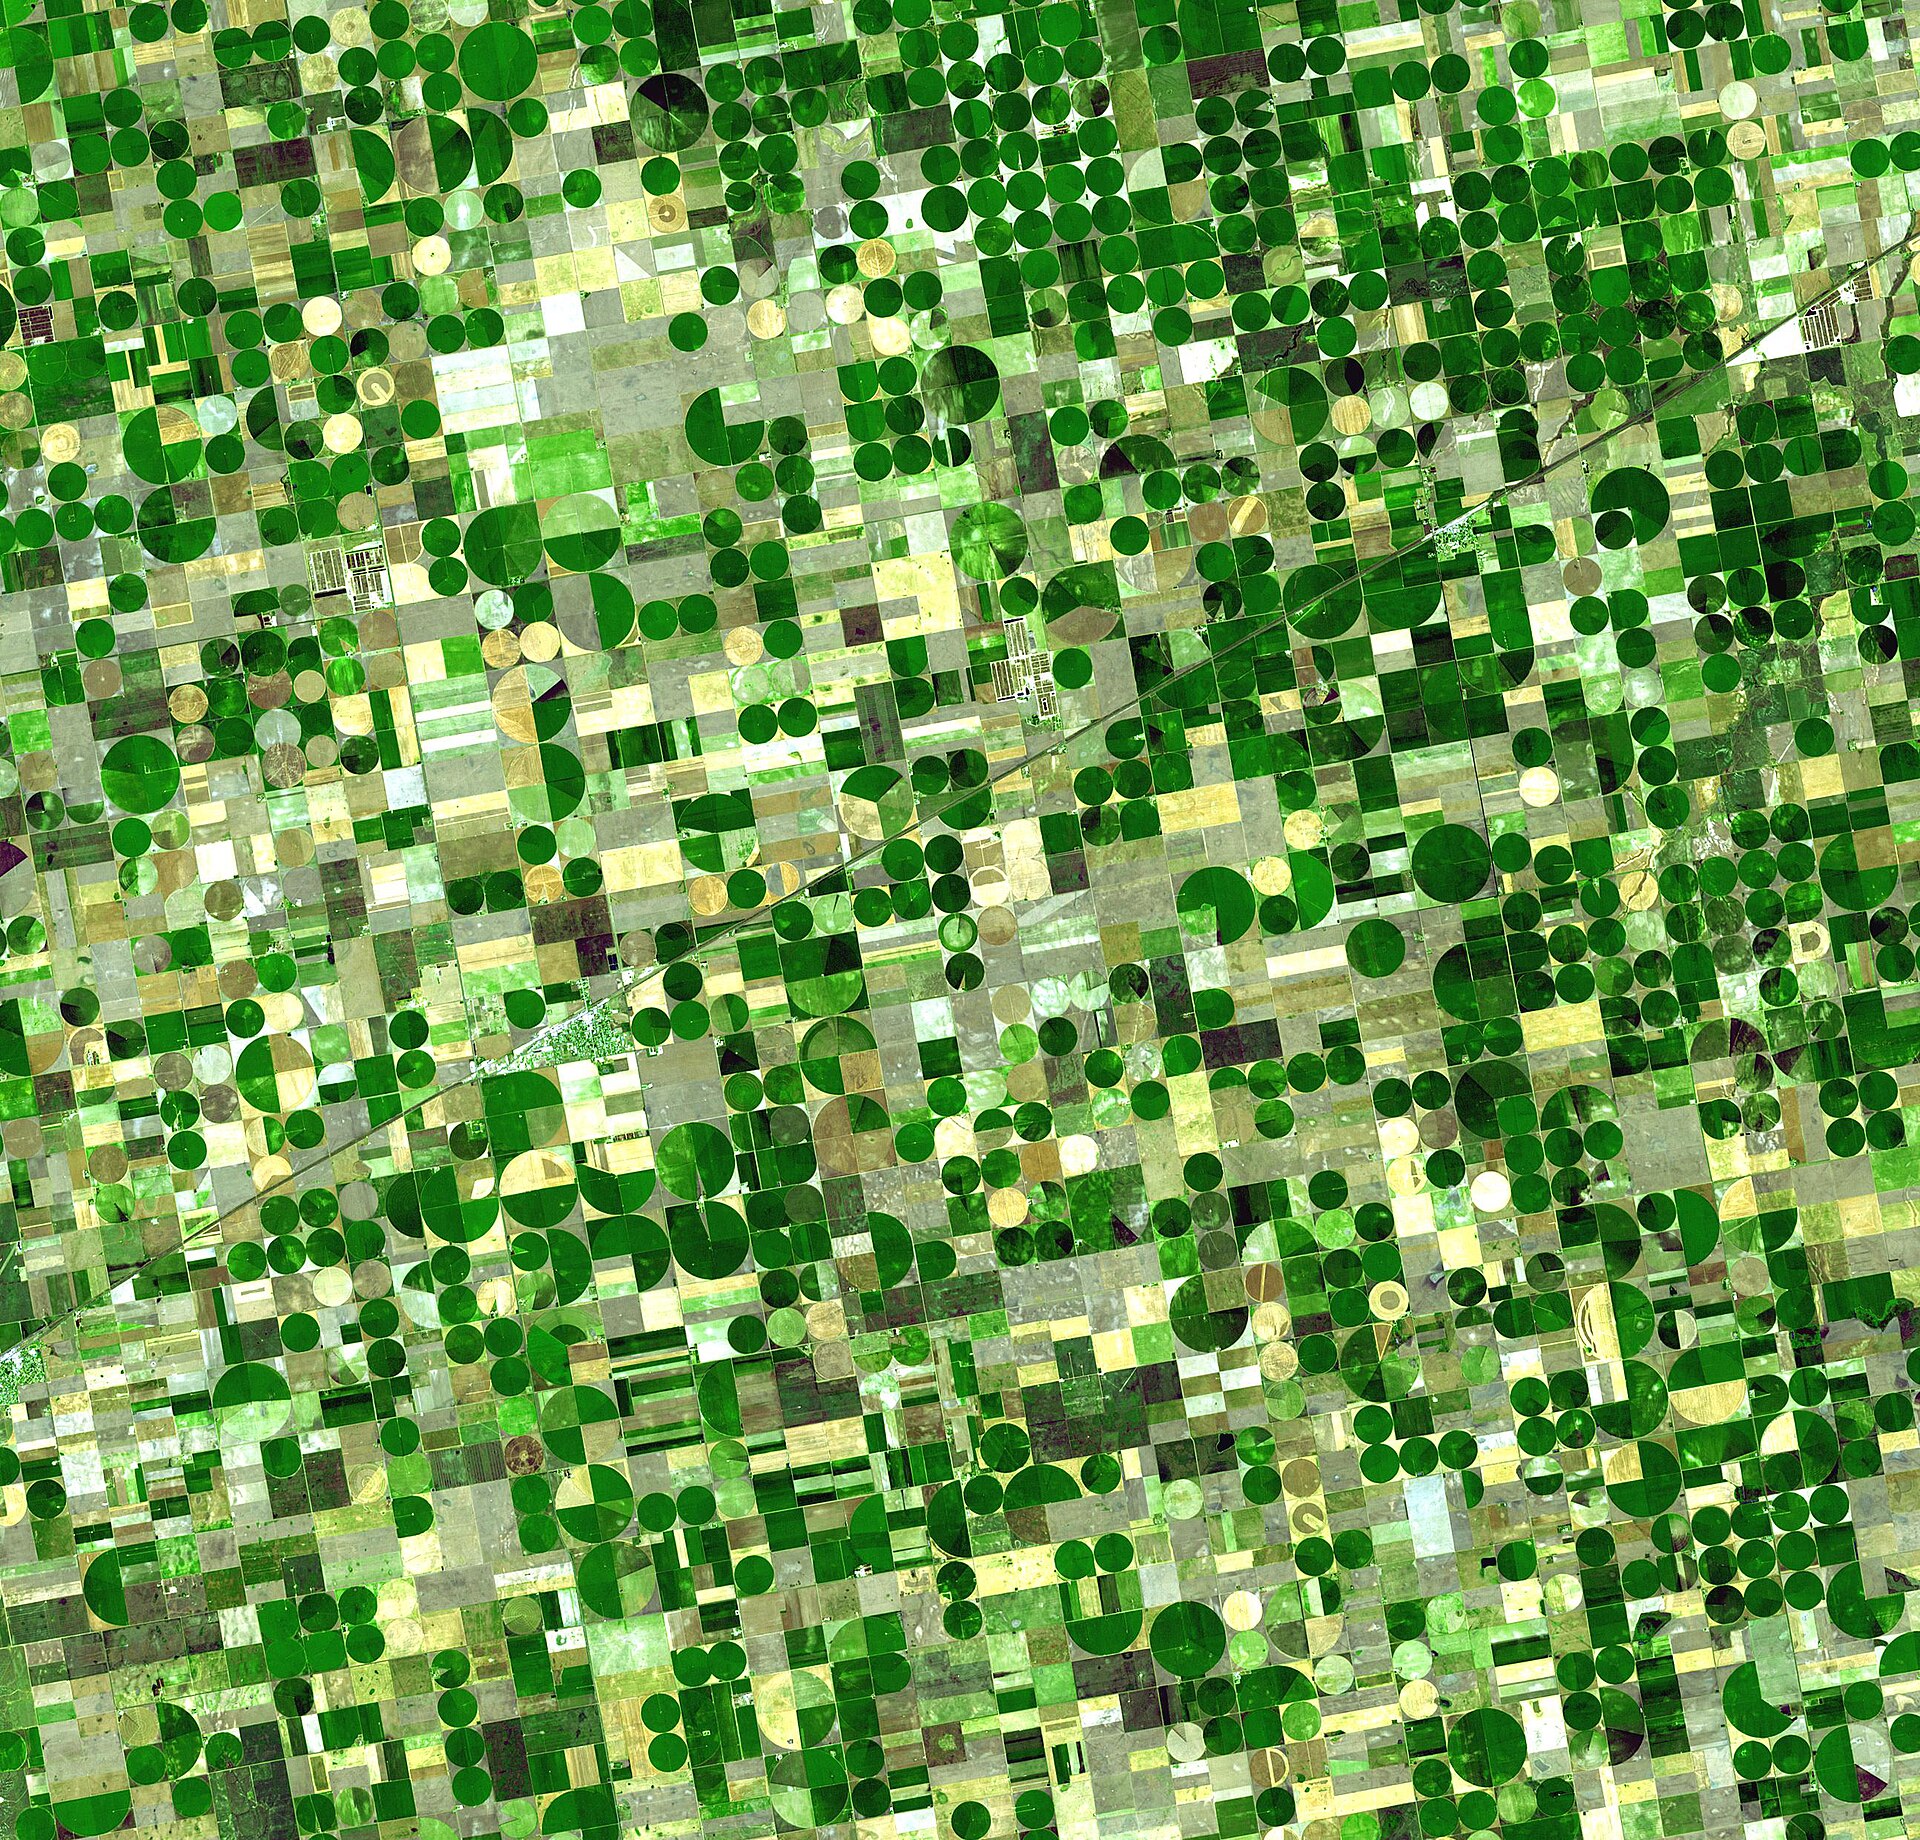
The cause, NASS said, was a processing error involving the acreage weights used to combine irrigated and non-irrigated corn observations. In the western Corn Belt, irrigated and rain-fed fields can sit side by side and produce very different harvests, so NASS samples them separately and then blends them in proportion to how many acres each type covers. Lance Honig, who chairs NASS's Agricultural Statistics Board, said a computer file had "incorrectly combined irrigated and non-irrigated corn acreage data." He added: "The original field survey information itself was accurate."
The corrected numbers, published in the reissued report, raised Nebraska's September yield forecast from 177 to 182 bushels per acre and cut Kansas from 121 to 118. The national yield rose from 178.5 to 178.8 bushels per acre, and the national production forecast went up by 28.4 million bushels, to about 15.83 billion. Some news outlets printed the corrected Kansas figure as 119; the reissued NASS table gives 118. NASS also said it had reviewed its October data and that the October forecasts, a national yield of 181.2 bushels per acre and production of 16.034 billion bushels, stood unchanged.
Why a few bushels per acre matter so much
On its face a 0.3-bushel change to the national yield looks tiny. The problem was what it did to the story the numbers told. Faith Parum, deputy chief economist at the American Farm Bureau Federation, calculated in an analysis published on 27 October that the correction shrank the apparent rise in national production between September and October from about 234 million bushels to 206 million, roughly 12 percent less. Nebraska's apparent jump in yield over that month fell from 11 bushels per acre to six.
That jump had already rattled growers. The Nebraska Corn Board wrote to USDA on 12 October, before the error was known, noting that the September report "decreased Nebraska's yield by 6 bushels per acre from August, only to raise it 11 bushels per acre in October." Many farmers in the state, much of which had been in moderate to extreme drought during the season, doubted the higher figure, Nebraska Public Media reported.
Markets reacted sharply to the October report. When it showed a national yield of 181.2 bushels per acre against trade expectations near 177.7, December corn futures fell 20.5 cents on 9 October, according to Parum. She was careful to note that not all of that drop can be pinned on the September error. "Accurate, timely USDA estimates are essential to market transparency, price discovery," she wrote, adding: "Unfortunately, revisions, especially market-moving revisions, undermine trust in the accuracy of the reported data."
Farm groups were blunter. Matt Frostic, a Michigan farmer and president of the National Corn Growers Association, said the error "is unacceptable" and "only further erodes farmer confidence," DTN reported. The Nebraska Corn Board and the Nebraska Corn Growers Association, in a joint statement, called the corrected report "an improvement" but said they "expect NASS to identify the source of the error and put safeguards in place so it does not happen again." NASS itself promised that "moving forward, we will implement additional pre-publication checks to verify acreage weights and validate objective yield calculations."
How a US crop forecast is built, field by field
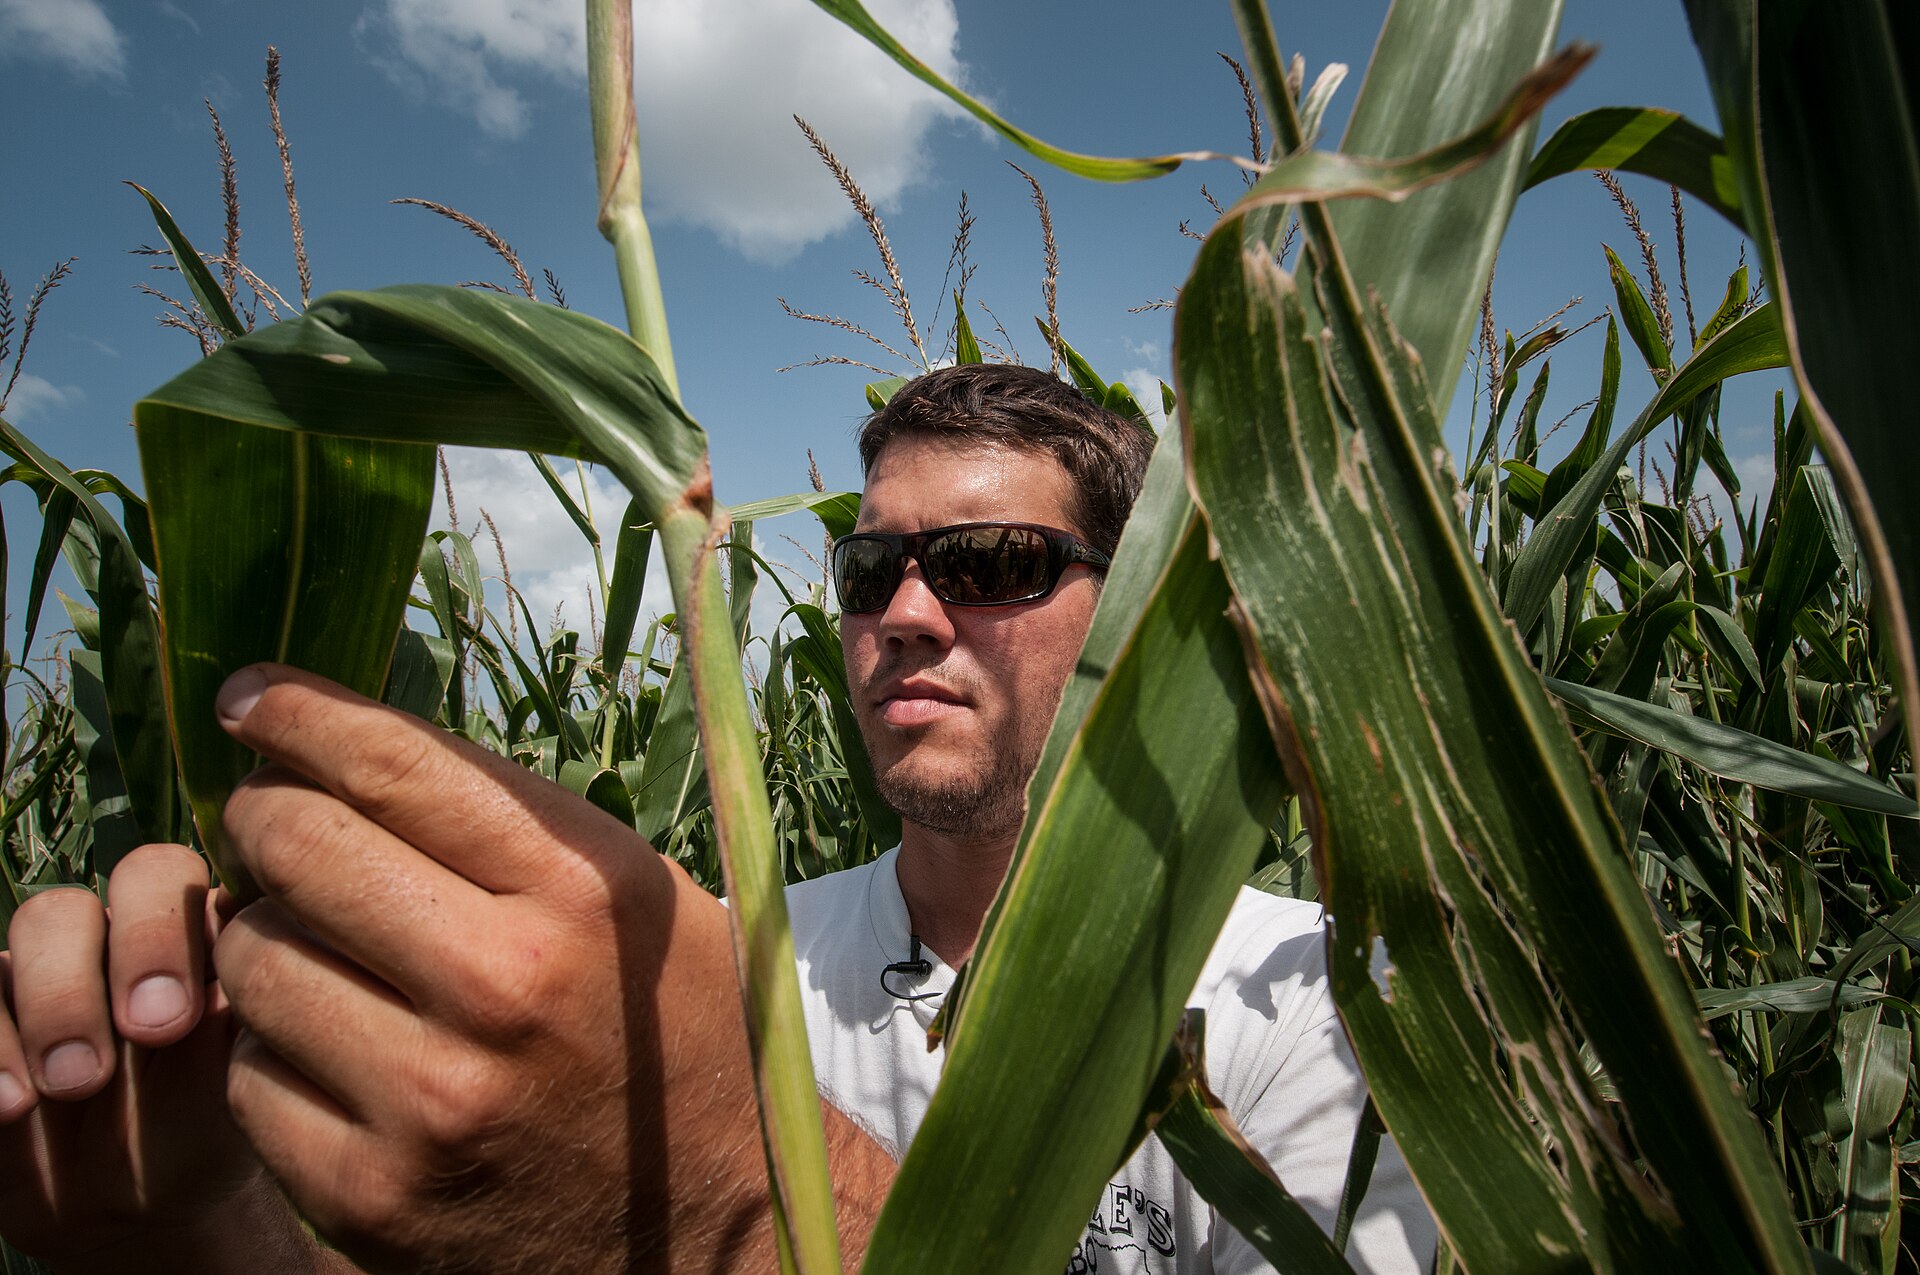
To understand where an AI check fits, it helps to know how the forecast is made. The November report sets out the method. Between 24 October and 4 November, NASS enumerators carried out two kinds of survey. In the objective yield survey, they revisited randomly selected plots in the major producing states, which usually account for about three quarters of US production, and counted plants, ears, bolls or pods. Those counts, combined with data from earlier years, give a projected biological yield, from which the average harvesting loss is subtracted.
In the farm operator survey, about 6,300 producers were interviewed, mostly by telephone, with some mail, internet and in-person interviews, and asked about their probable yield. NASS's Agricultural Statistics Board then reviews these numbers alongside USDA administrative acreage data, satellite imagery and weather and crop progress records, checking each for "reasonableness and consistency with historical estimates."
This system has a long record. NASS publishes a measure of its own accuracy: over the past 20 years, the November corn forecast has differed from the final estimate by 1.3 percent on the root mean square error measure, with a 90 percent chance that the gap will not exceed 2.3 percent. The September error was not a failure of the fieldwork, which Honig said was accurate. It was a failure in the processing that turned that fieldwork into a number, the kind of fault that internal checks are meant to catch.
What an anomaly-checking AI can and cannot do
USDA has not released technical details of its tool, so any description of how it works beyond what officials have said would be guesswork. What officials have said is that it looks for unusual patterns and inconsistencies in the data before publication, and that it is meant to complement existing verification rather than set any estimate itself.
In general terms, this is a well-established use of machine learning. Anomaly detection systems learn what normal relationships in a data set look like, for example how a state's yield usually relates to its plant counts, its weather, its irrigated share and its own history, and then highlight figures that break the pattern. A weighting mistake of the kind NASS described changes the relationship between irrigated and rain-fed results in a way that a model trained on past reports might well spot. That is presumably what Hutchins meant when he said the tool would have caught the September problem, although USDA has not published the test.
The limits are equally important. An anomaly flag only says that something looks odd. Unusual numbers are sometimes simply true, as in a drought year or after a sudden storm, and a human still has to decide. A tool trained on history can also struggle with genuinely new conditions. And no checker can fix data that farmers never supply. That is why statisticians generally describe such systems as a second pair of eyes, which matches USDA's own description.
A trust gap that software alone may not close
The September error landed on top of existing doubts. Reuters reported in September that farmers, grain traders and economists had complained about USDA data after deep staff cuts and unusually large increases between the first and final estimates of the corn area planted and harvested in 2025. Nebraska Public Media reported that NASS lost 37 percent of its staff in the first year of the current administration, the largest percentage drop of any USDA agency. Hutchins has said the September mistakes were unrelated to the staffing reductions.
An online survey by the consultancy Ag View Solutions, carried out from 25 to 28 October with nearly 1,200 responses from 38 states, found that nearly three quarters of respondents had little or no confidence in USDA reports, FarmWeek reported. Only 38 percent said they had filled in a USDA survey in the past two years, according to AgWeb. Asked what would restore trust, 33 percent chose a USDA partnership with private industry, 30 percent a radical change in surveys and reporting, 23 percent greater use of Farm Service Agency and crop insurance data, and 12 percent satellite or AI tools. The survey was not a random sample, so its figures describe its respondents rather than all US farmers.
Survey statistics depend on people answering. Cory Walters, an agricultural economist at the University of Nebraska-Lincoln, told Nebraska Public Media that fewer farmers are responding to NASS surveys, and that consolidation into fewer, larger operations makes replies less likely. An AI check can catch a processing slip, but it cannot replace missing responses.
Satellites, NASA and a wider push to modernise
The AI checker is one part of a broader effort. At the Farm Progress Show in Iowa on 1 September, Agriculture Secretary Brooke Rollins announced a pilot to test better satellite imagery, geospatial tools and crop models alongside farmer surveys to estimate acreage and yields, with AI and machine learning also to be explored. "We will conduct a pilot to evaluate the use of improved satellite imagery," she said. Hutchins said USDA also wanted to raise response rates, for example by moving surveys online and pre-filling answers. "We're gonna have results by the end of the term, for sure," he said. An Iowa farmer at the show, Jeff Mundorf, told Reuters: "Some of these methods have not changed since the 1970s."
On 24 October, the day after the first correction notice, Rollins and NASA Administrator Jared Isaacman signed a memorandum of understanding at the University of Alabama in Tuscaloosa. According to NASA, the two agencies may cooperate on agricultural statistics, remote sensing science, modelling and geospatial data engineering, with the aim of improving crop monitoring, acreage and yield estimates and drought and disaster assessments. No timeline for satellite-based estimates entering the official reports has been announced.

What the November report showed
The first report checked by the new tool cut the corn forecast. NASS put 2026 corn production at 15.9 billion bushels, down 1 percent from October and 6 percent from 2025, with an average yield of 179.6 bushels per acre, down 1.6 bushels from October and 6.9 bushels below last year's record. If realised, it would still be the second largest US corn crop on record. Soybeans moved the other way, to a record 4.57 billion bushels on a record yield of 53.3 bushels per acre.
The two states at the heart of the September error both slipped. Nebraska's yield forecast fell from 188 to 184 bushels per acre and Kansas's from 125 to 124. In the World Agricultural Supply and Demand Estimates released the same day, USDA cut projected US corn ending stocks to 1.758 billion bushels and its season-average farm price forecast by 10 cents to $4.60 a bushel. NASS said that, based on 20 years of results, there is a 90 percent chance final corn production will land between 15.5 and 16.3 billion bushels.
Why the rest of the world watches a US crop report
The episode is not a purely American concern. USDA's Economic Research Service describes the United States as the world's largest producer, consumer and exporter of corn, and the country exports 10 to 20 percent of its corn crop. US forecasts feed directly into futures prices in Chicago, which in turn shape what importers around the world pay for maize and animal feed. When a US number is wrong, the cost does not stay inside US borders.
For farmers in developing countries the link is indirect but real: world grain prices feed into local maize and feed prices that poultry, dairy and fish farmers pay, and reliable data helps governments decide when to import and how much to store.
How other countries use satellites and models
Many crop monitoring systems already combine satellites, weather data and models with ground reports. The European Commission's Joint Research Centre has run its Monitoring Agricultural ResourceS (MARS) programme since 1988, publishing monthly crop yield forecasts to support the EU's Common Agricultural Policy and early warnings for food-insecure countries, using weather data, crop models and satellite imagery. At the global level, G20 agriculture ministers launched the GEOGLAM initiative in 2011; since September 2013 its Crop Monitor has supplied monthly satellite-informed assessments of wheat, maize, rice and soybean conditions to the Agricultural Market Information System, and a separate Early Warning Crop Monitor followed in 2016.
India's Mahalanobis National Crop Forecast Centre, set up by the agriculture ministry in New Delhi in 2012, runs the FASAL programme, which combines satellite, weather and field data to issue pre-harvest forecasts at national, state and district levels. Experiences like these suggest that satellite and model-based systems work best when they are calibrated against good ground data, not instead of it.
The data gap where it matters most
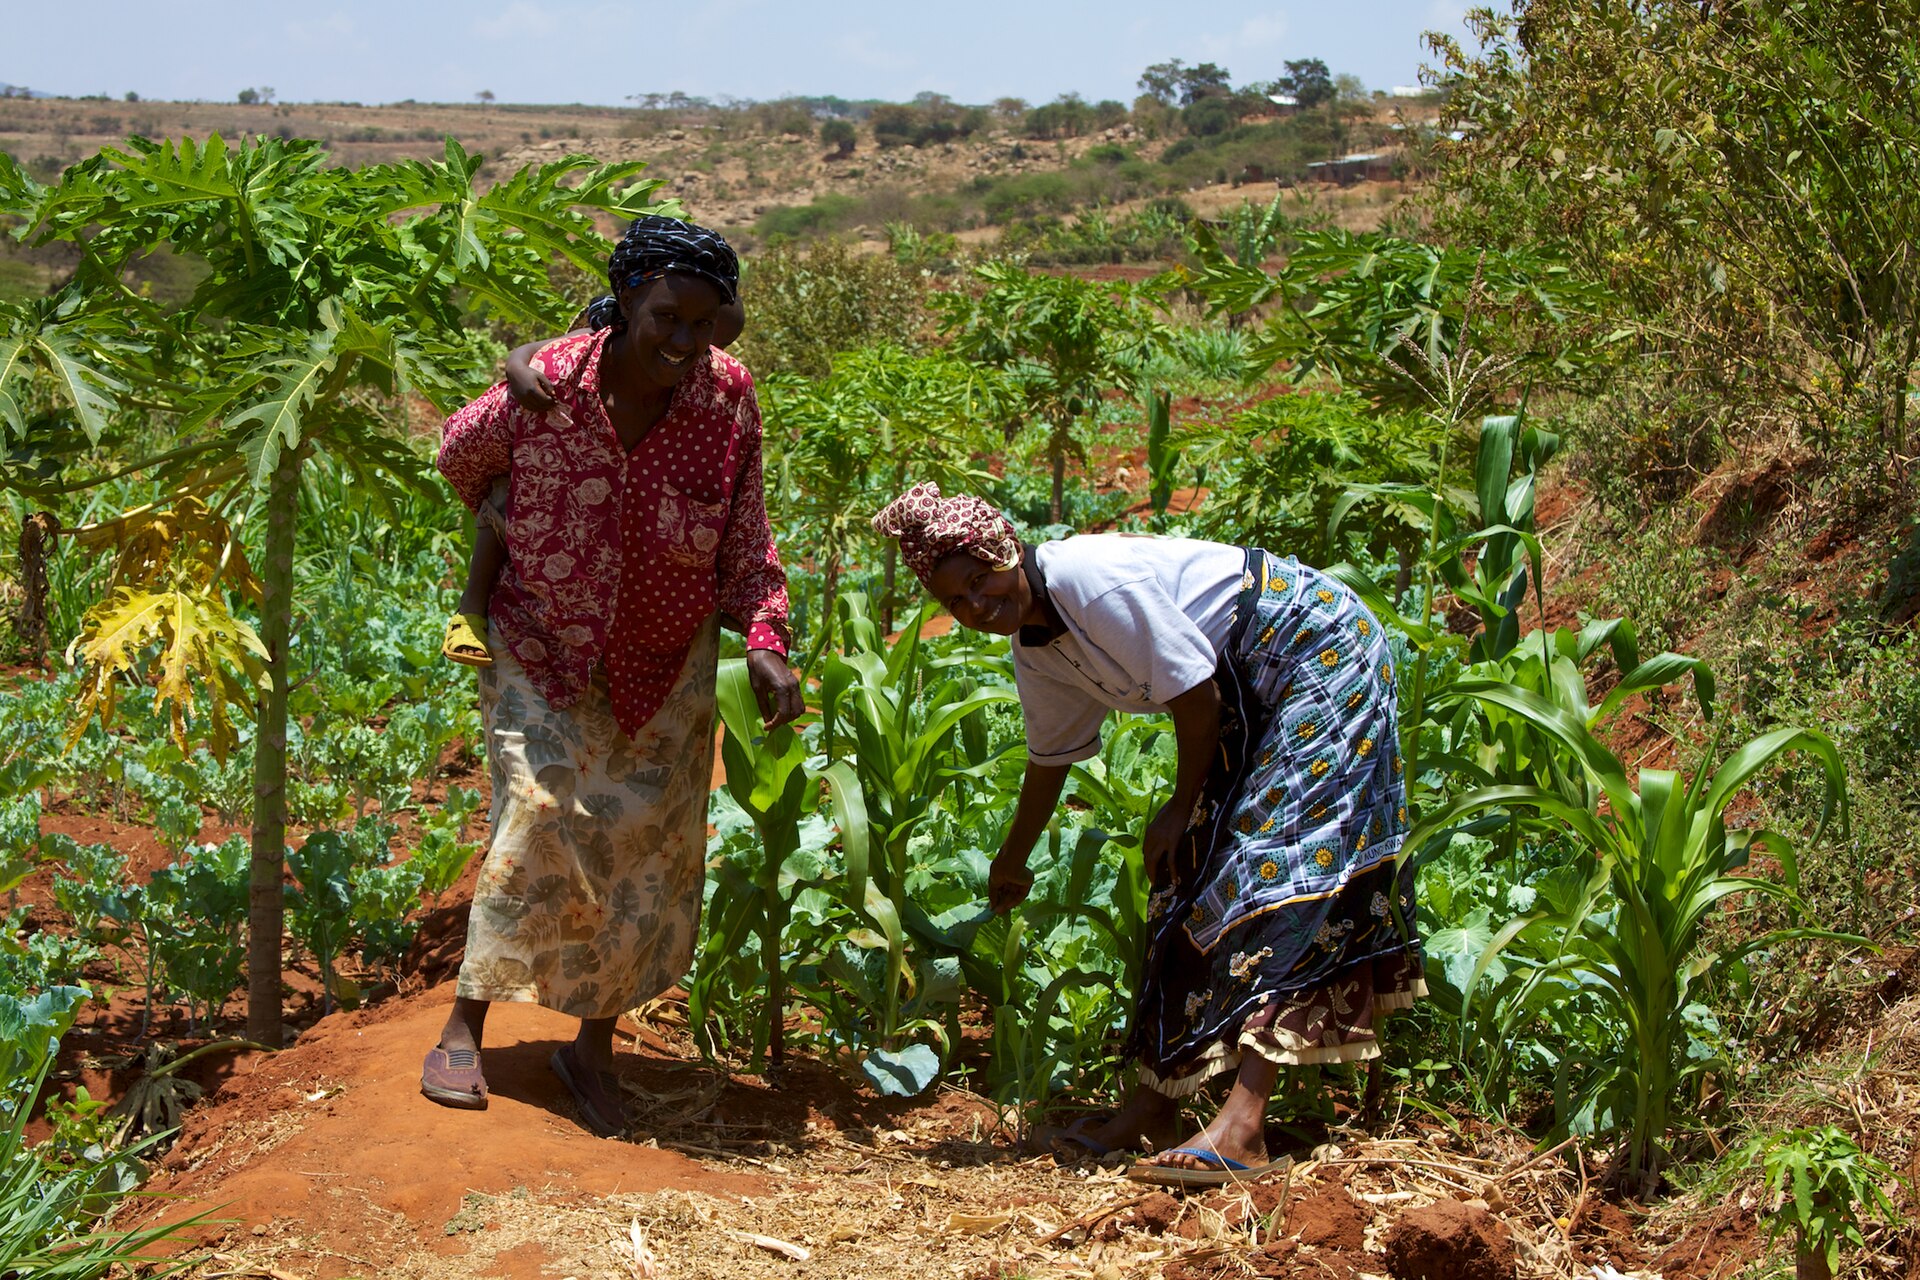
For many lower-income countries the challenge is not checking good data but collecting any. The 50x2030 Initiative, launched in 2018 by FAO, the International Fund for Agricultural Development and the World Bank with several donors, aims to help about 50 low and lower-middle income countries build regular agricultural surveys by 2030. The partners have pointed out that agricultural data gaps affect countries that are home to most of the world's poorest people.
If one of the world's best funded statistical agencies can be tripped up by a weighting error, smaller offices with fewer staff face greater risks. AI checks could help them too, if they are transparent, cheap to run and built on reliable surveys. Trained on thin data, or treated as verdicts rather than warnings, they could mislead.
The real test comes with the final numbers
The coming months will show whether the new checks restore confidence. NASS will publish its end-of-season estimates for corn and other row crops in the annual Crop Production summary in January, the point at which the 2026 forecasts can be compared with the final count. USDA has not said whether it will publish details of its AI tool, how it was tested, or what it flags.
For now the episode shows how much depends on the plain work of counting ears of corn and adding up acres correctly. Artificial intelligence may help catch the next mistake before it moves a market. It will earn trust only if the agency is open about what the tool does and keeps investing in the people and surveys that produce the numbers in the first place.
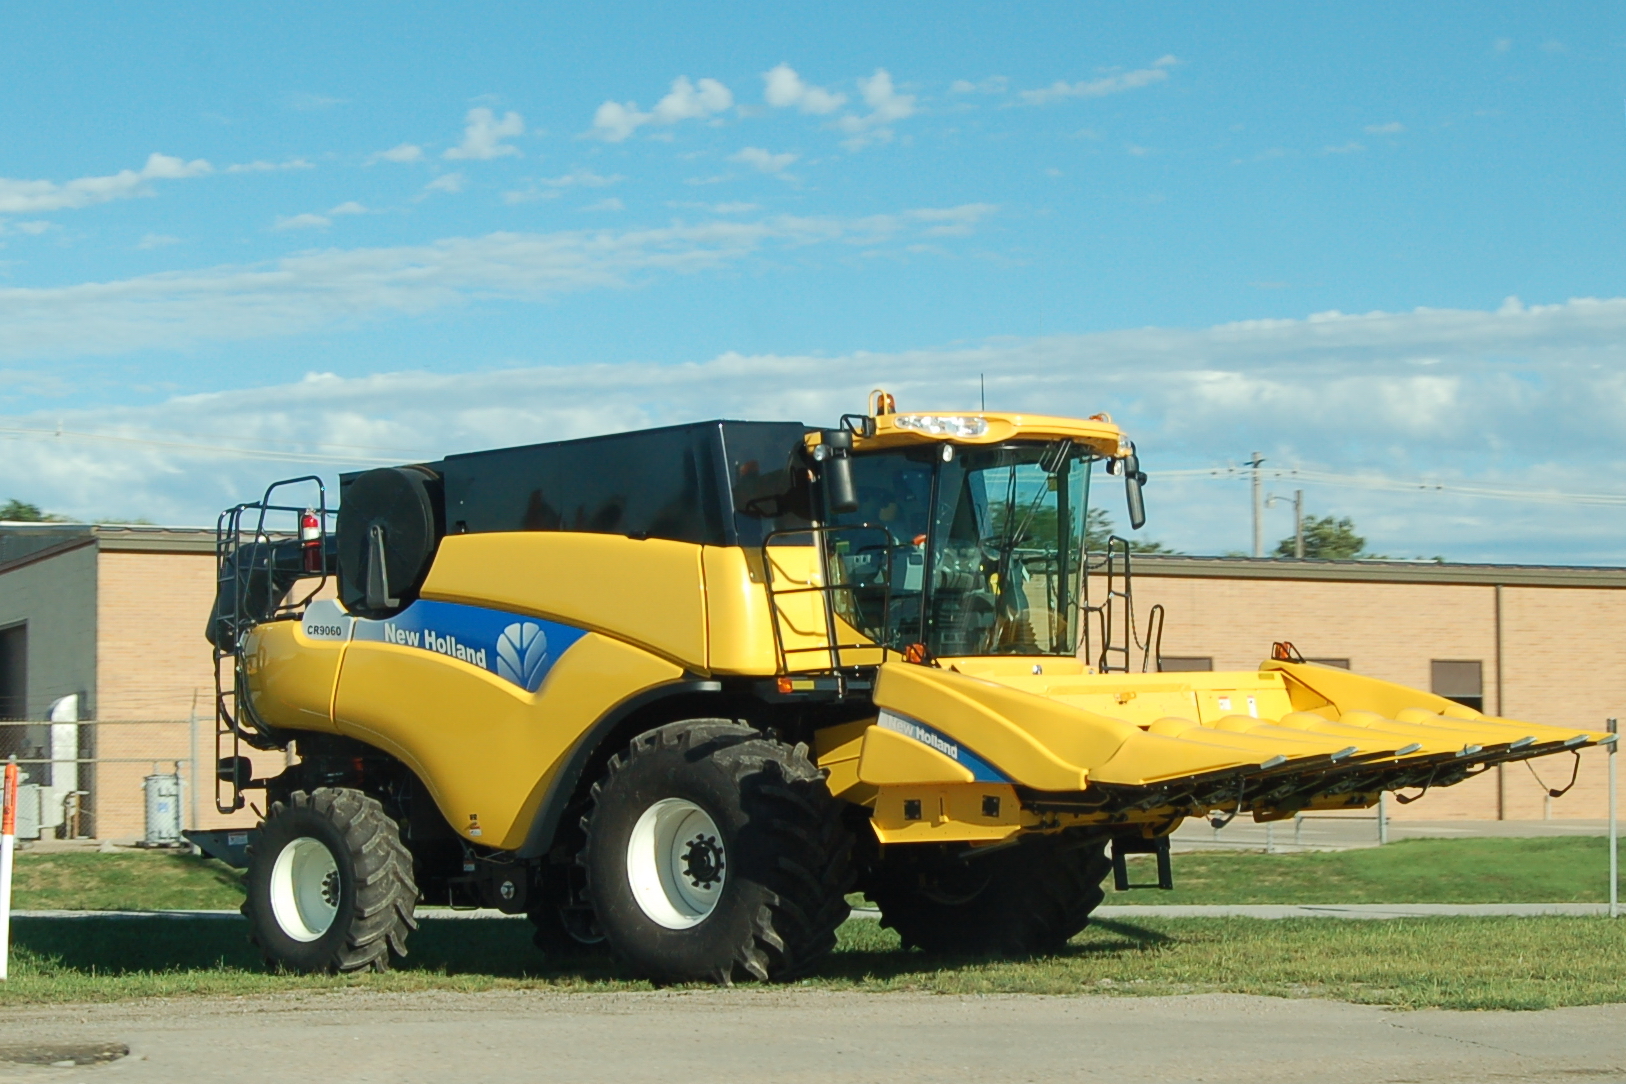
Photo: Katrina Wiese / Wikimedia Commons (CC BY-SA 2.0). The top picture shows a combine harvesting corn near Beatrice, Nebraska, in September 2010, as background.
Comments
(0)