
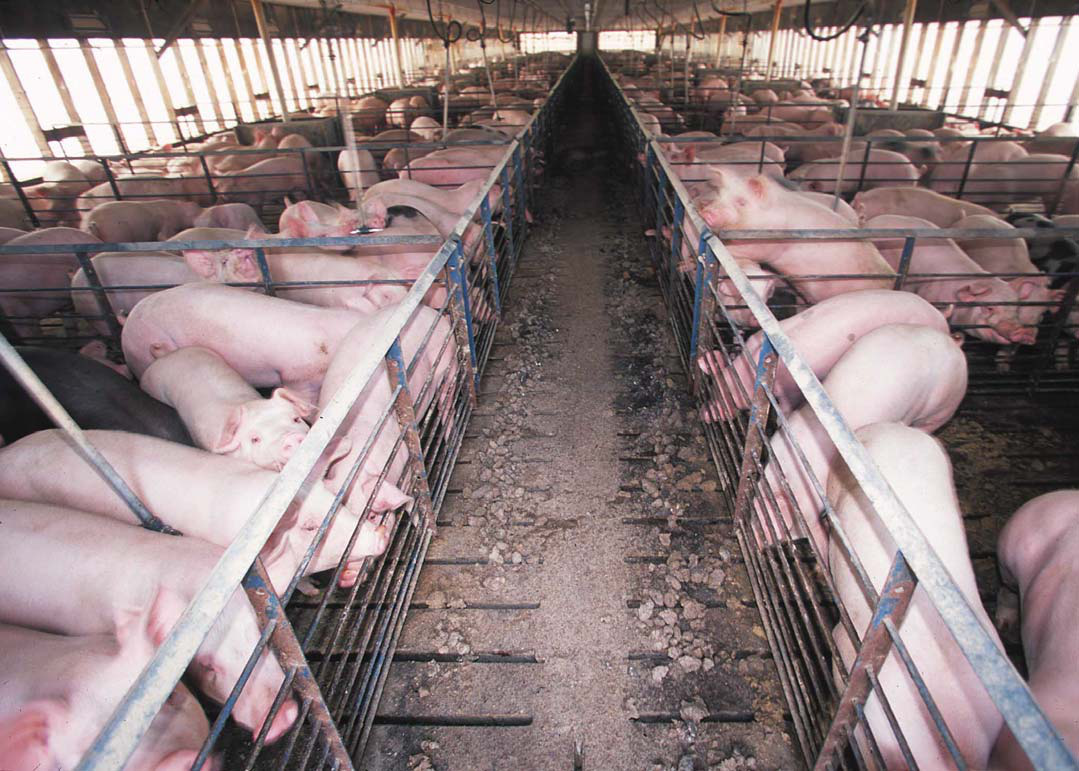
Larger hog finishing operations in the United States generally spend less to put 100 pounds of weight on a pig than smaller ones, according to a chart released by the US Department of Agriculture's Economic Research Service.
The chart draws on five benchmark years of nationally representative surveys: 1998, 2004, 2009, 2015 and 2020. Costs varied between years and between farms, but across those surveys total costs per 100 pounds of gain generally fell as operation size rose.
ERS ties the pattern to two items in particular. Ownership costs, meaning buildings, equipment and other capital investments, can be spread across more animals on a large operation, which cuts the cost per unit of output. Unpaid labour costs per unit were also generally lower on larger farms.
The researchers place the finding in a longer shift. Over the past 30 years, US hog production has consolidated into fewer, larger operations, and the agency describes that change as consistent with the link between size and lower unit costs.
Costs in the more recent survey years are higher overall, a trend ERS attributes to rising input prices over time rather than to farm size.
The chart comes from the ERS report The U.S. Hog Industry: Structural Change, Production Systems and Costs, and Manure Management, published in June 2026.
Photo: Unknown author / Wikimedia Commons (Public domain)
Source: ers_usda
Comments
(0)