
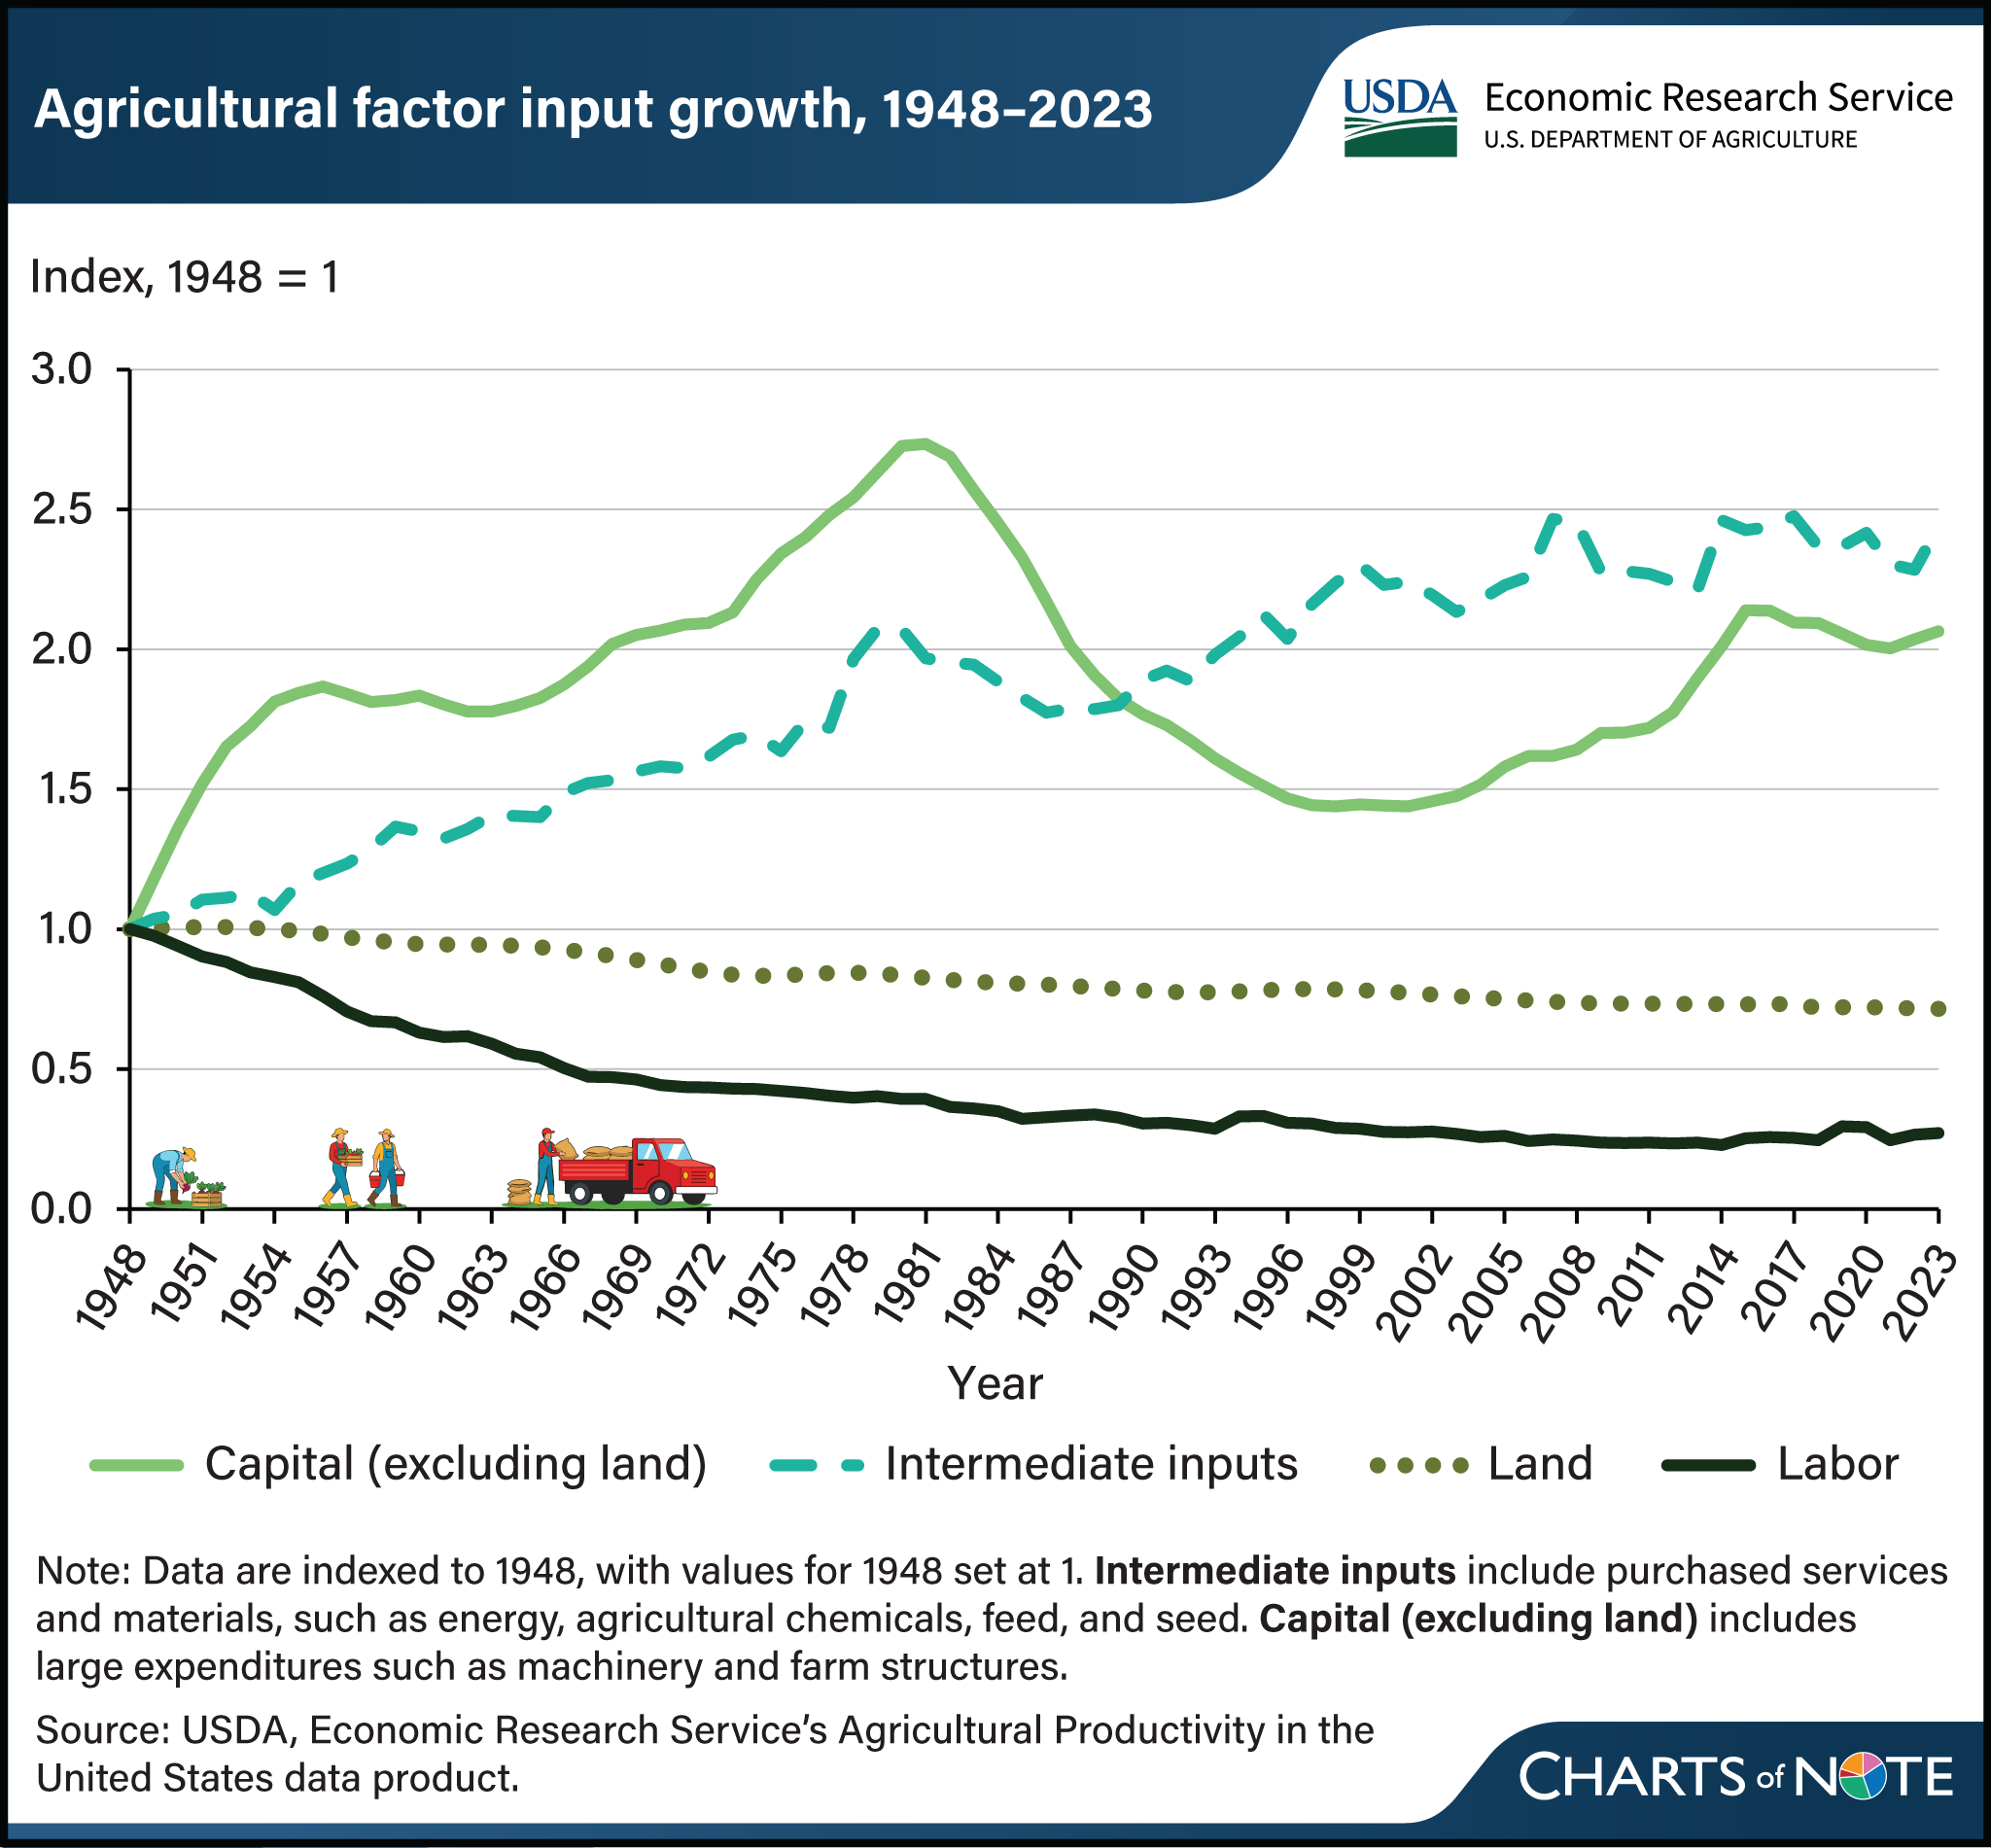
American farms produced nearly three times as much in 2023 as in 1948 while using almost the same total quantity of inputs, according to a new Chart of Note from USDA's Economic Research Service (ERS). Farm output in the chart covers livestock, crops and other farm-related production in a year.
Total input use rose at an average of only 0.12 percent a year over the 75 years. That small net change hides a large shift in what those inputs are.
Farm labor fell by 73 percent over the period and land use declined by 28 percent. Over the same years, intermediate inputs, which include fertilizer, pesticides, energy, feed and purchased services, grew by 144 percent. Capital inputs, including machinery and farm structures, increased by 106 percent.
ERS attributes the shift to technology: advances made machinery and agricultural chemicals more affordable and more effective, which allowed farmers to use more of them while using less labor and land.
The more striking figure is the gap between inputs and production. Agricultural output grew by 1.52 percentage points a year against the 0.12 points of input growth. The remainder of 1.4 percentage points a year is total factor productivity, and ERS calls it the primary driver of growth in US agricultural output.
In practical terms, nearly all of the long rise in American farm production came from getting more out of each unit of input, not from adding more resources in total.
The chart was prepared by Eric Njuki and draws on the ERS Agricultural Productivity in the United States data product, updated in July 2026.
Source: USDA Economic Research Service



Comments
(0)