
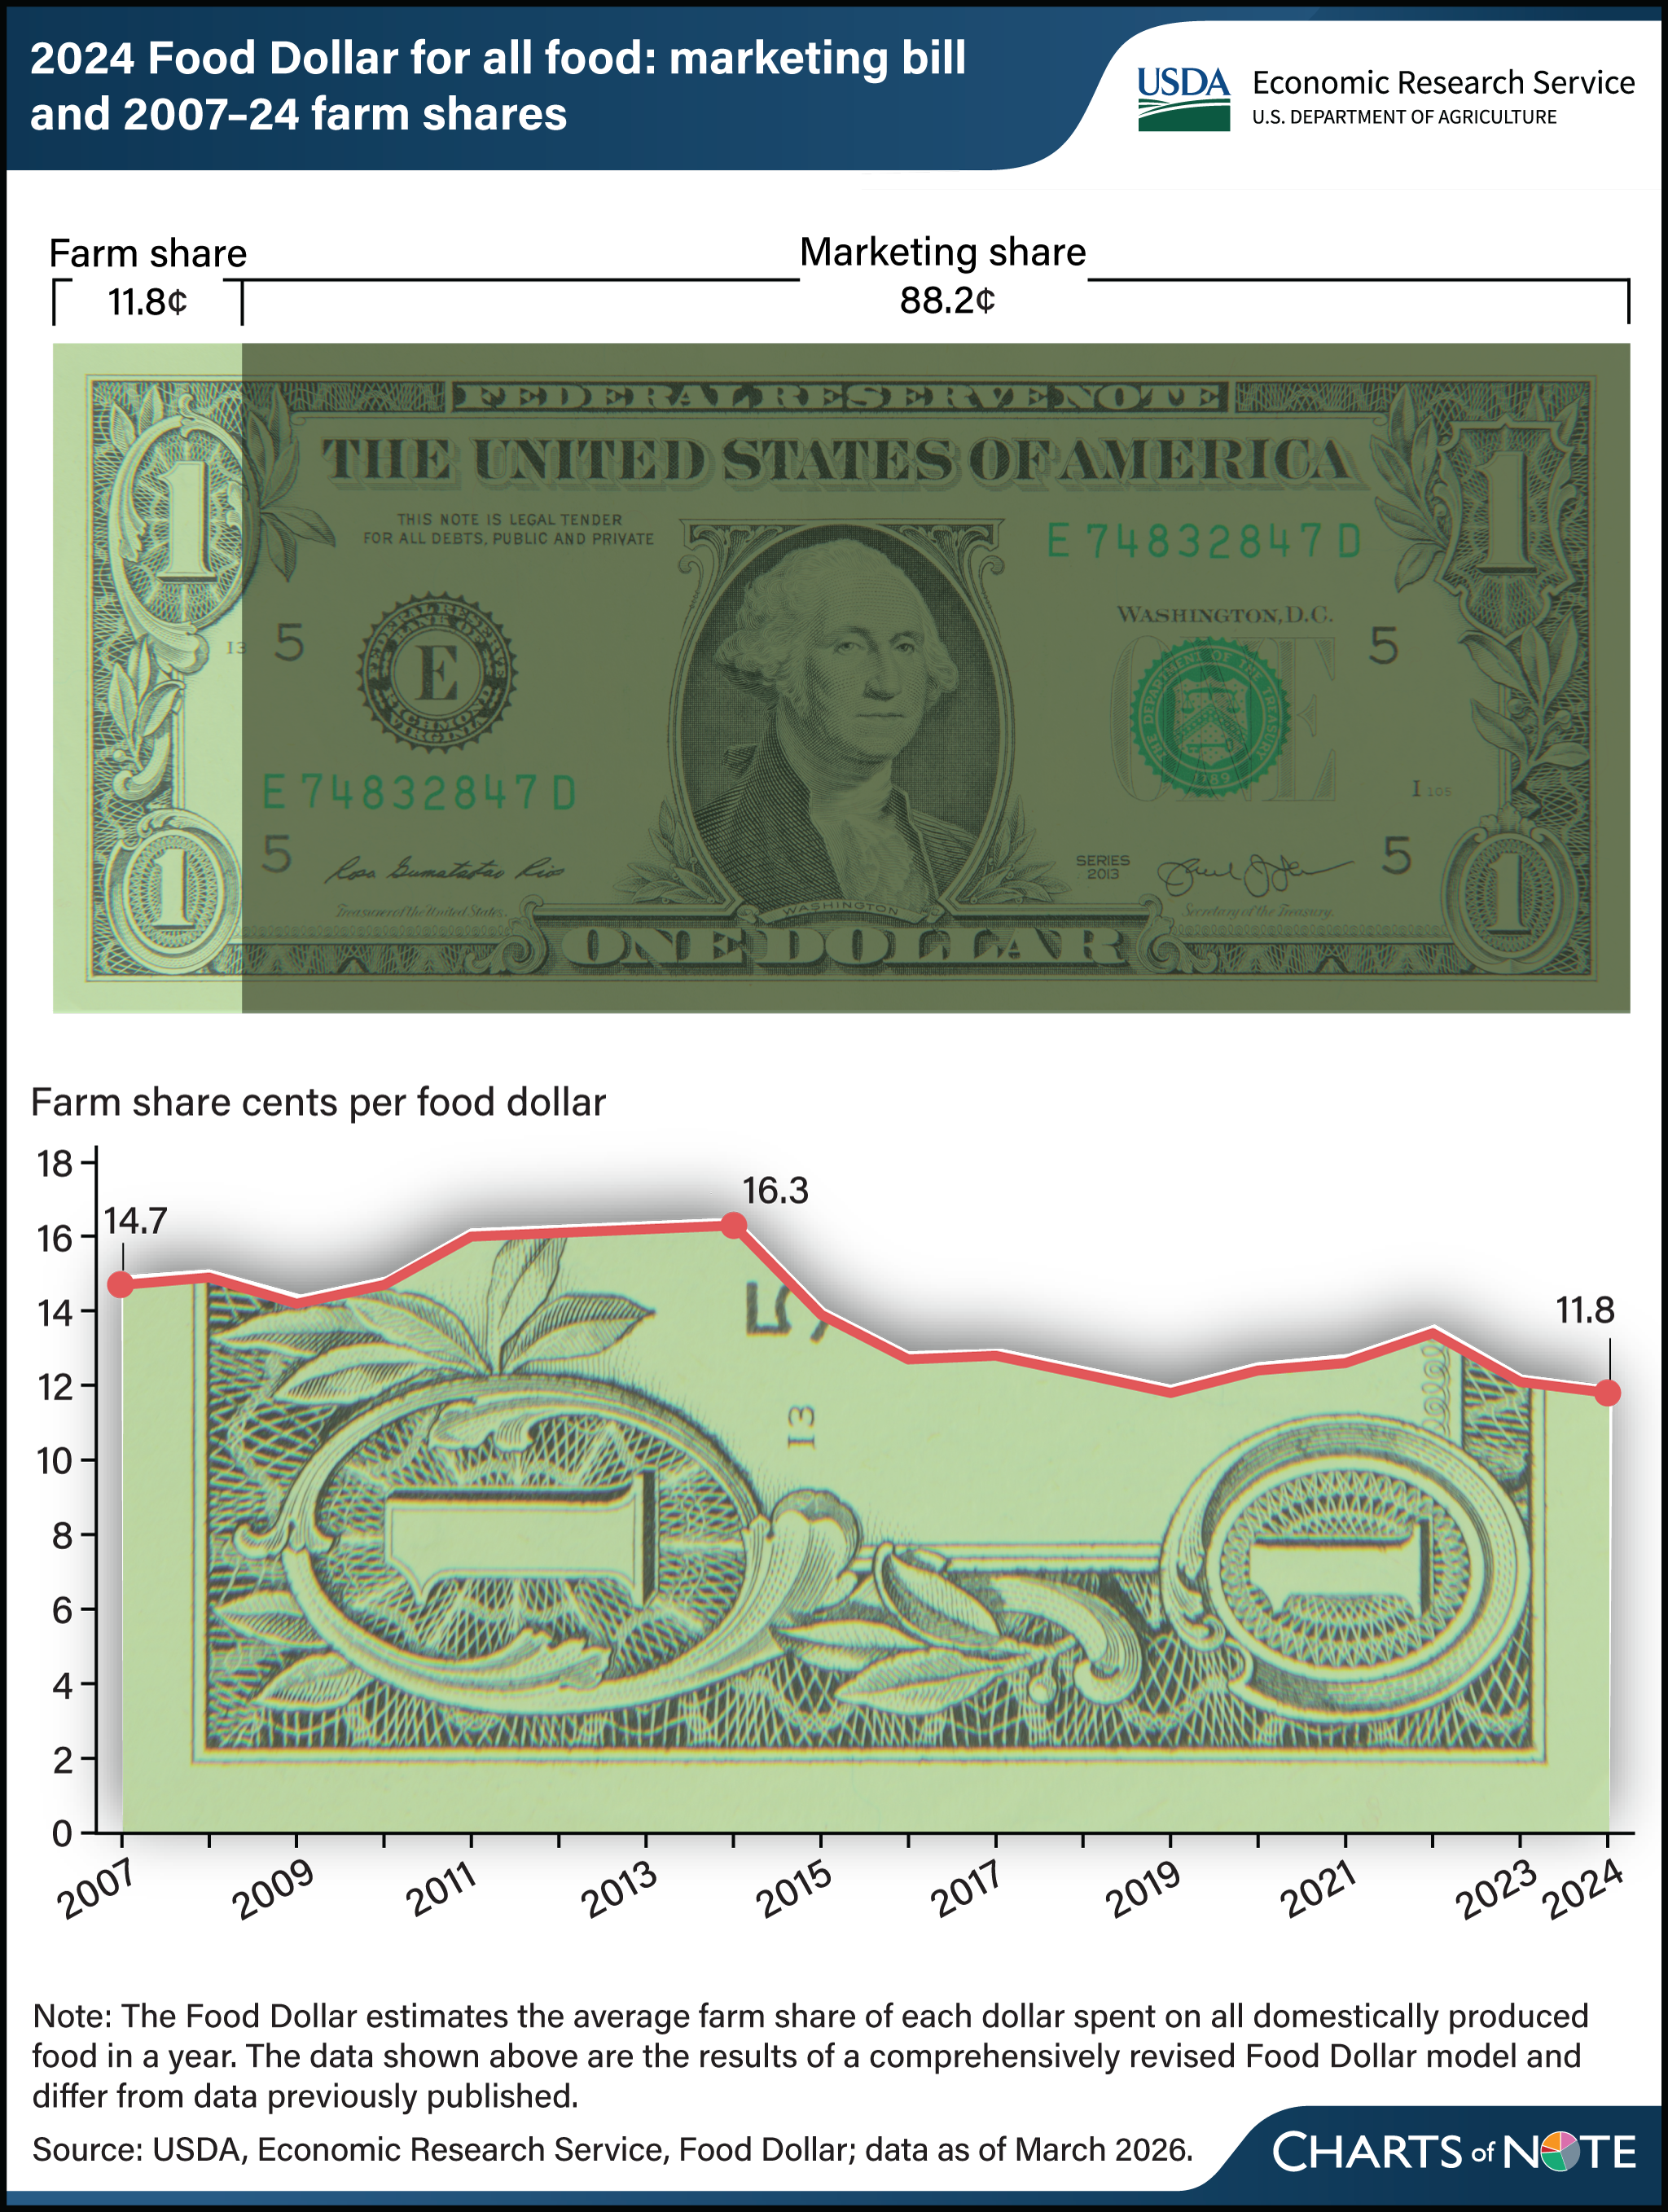
The farmer's share of the American food dollar slipped again in 2024, according to a Chart of Note from USDA's Economic Research Service (ERS) built on a comprehensively revised Food Dollar model.
In 2024, U.S. farm establishments received 11.8 cents of every dollar spent on domestically produced food sold at places such as grocery stores and restaurants. The 2023 farm share, on the same revised basis, was 12.1 cents.
The remaining 88.2 cents of the 2024 food dollar is the marketing share, which covers post-farm costs such as transporting, processing and selling food to consumers.
One factor behind the long-term downward trend in the farm share, ERS says, is the rising proportion of spending on food away from home, such as restaurant meals. That food carries a higher marketing share because of the added costs of preparing and serving it.
ERS updated the Food Dollar in 2026 with changes to both methodology and source data, and all the figures in the chart, including the 2023 share, come from the revised model. More detail on the revisions is in the ERS report A More Detailed Food Dollar: Enhanced Accounting of U.S. Food Costs, and the data are in the ERS Food Dollar data product, updated on March 10, 2026.
The farm share is the single number that tells growers how much of what consumers pay for food ever reaches the farm gate, and this release resets the baseline for tracking it. The chart was prepared by ERS economists Quinton Baker and James Chandler Zachary.
Source: USDA Economic Research Service

Comments
(0)