
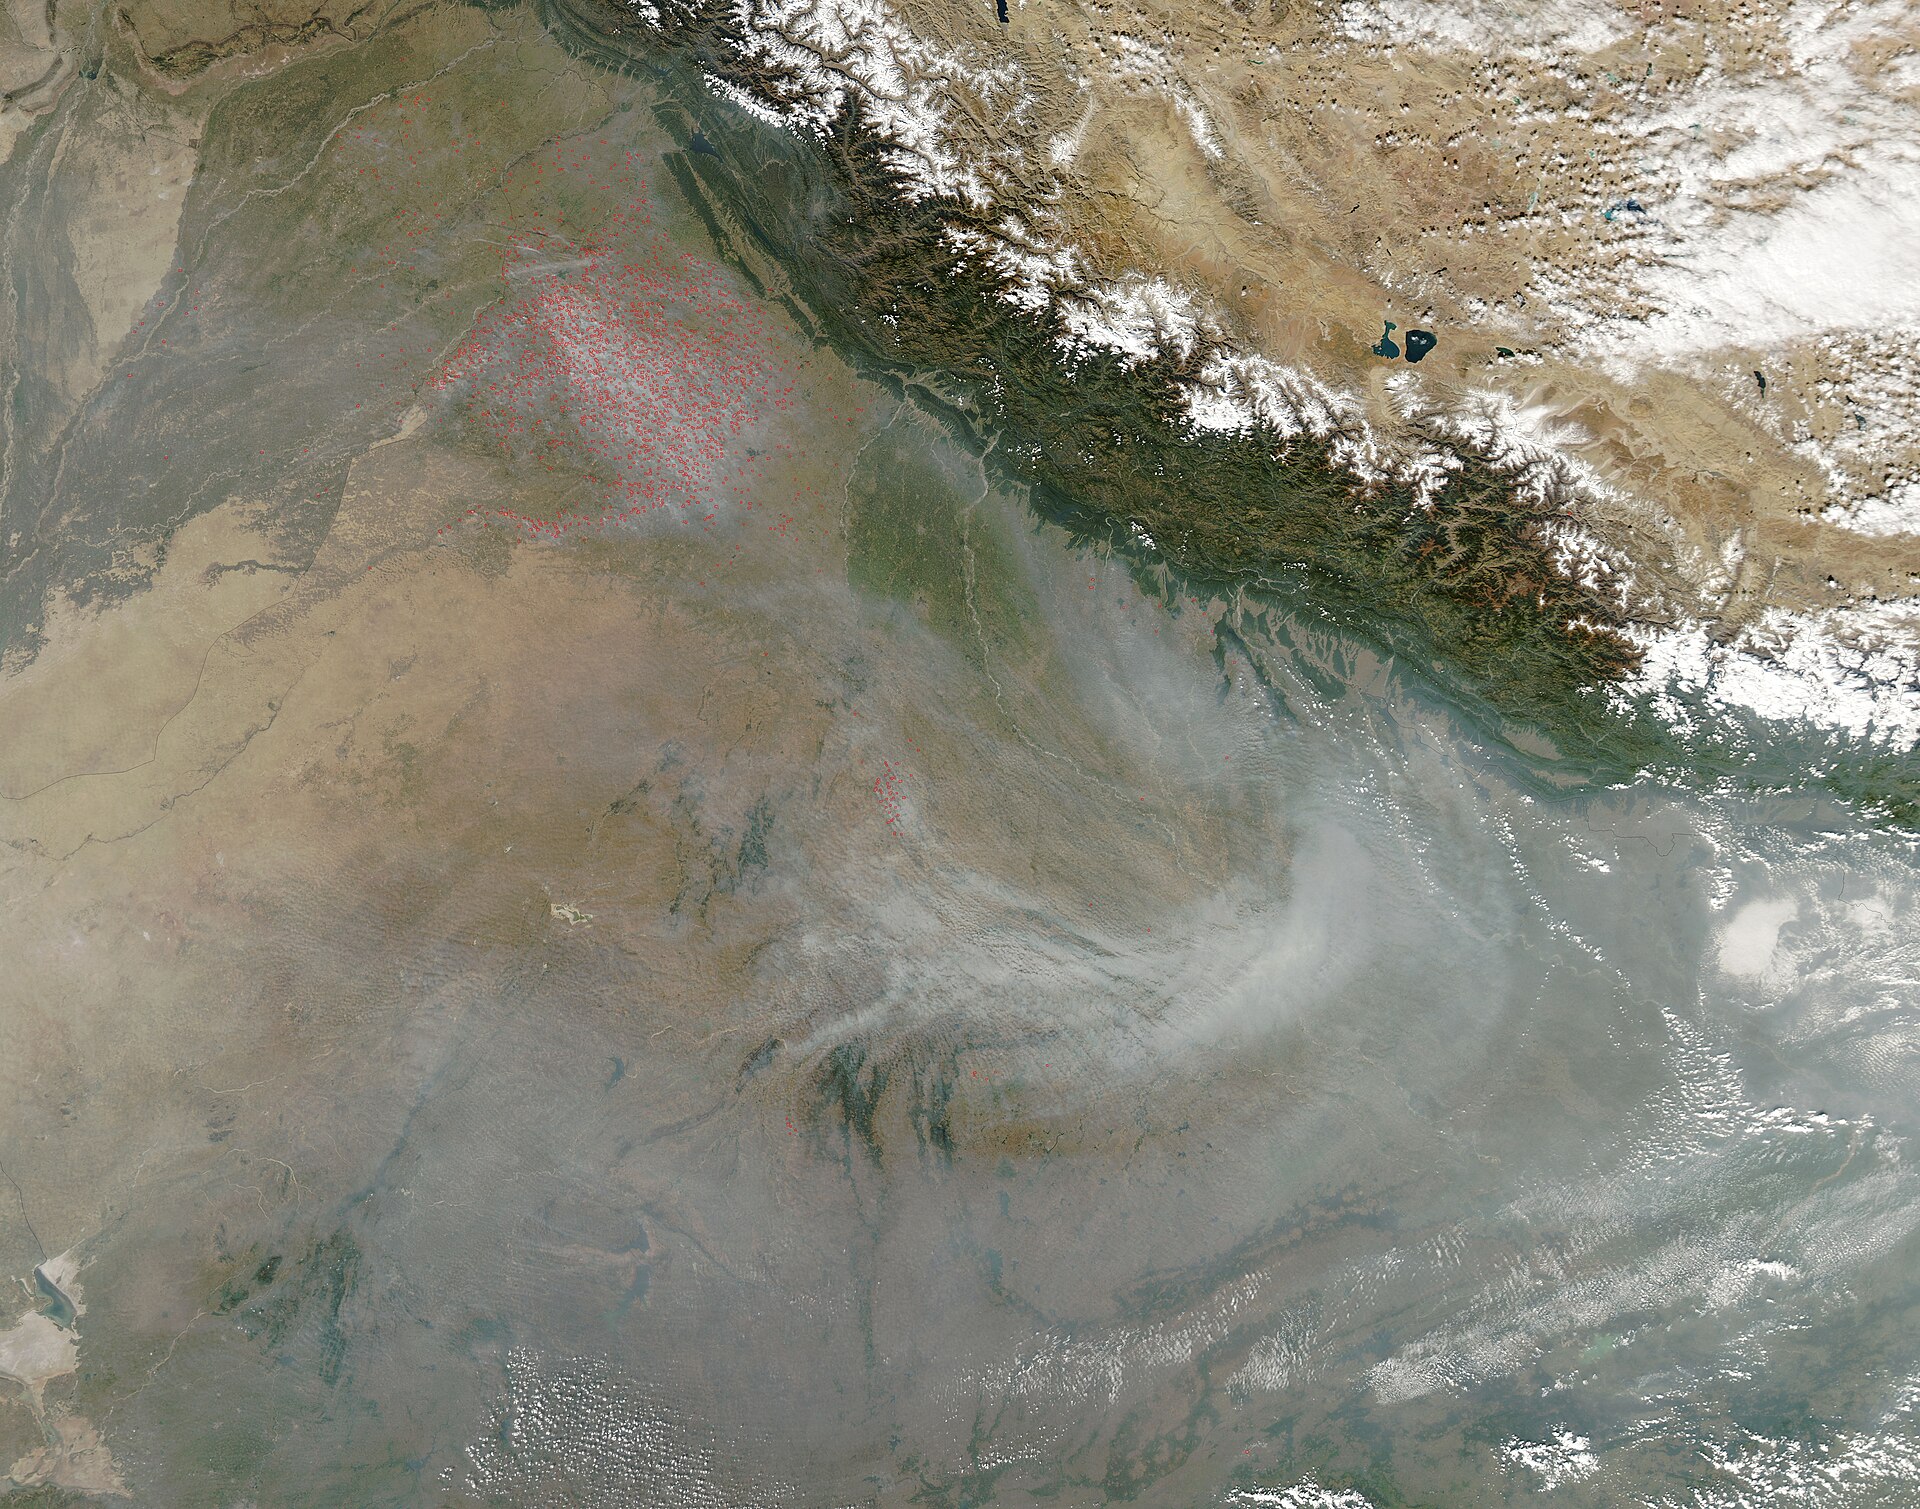
A NASA-based scientist says satellites may have missed most of this autumn's crop-residue fires in northwest India. Hiren Jethva, an aerosol remote-sensing scientist with Morgan State University who works at NASA's Goddard Space Flight Center, estimated on 9 November that about 34,000 farm fires burned in Punjab and Haryana between 1 October and 9 November 2026, against an official tally of 4,459 fires in Punjab alone up to 8 November.
The gap is not about two people counting differently from the same picture. It is about when the pictures are taken. India's official fire count rests on polar-orbiting satellites that pass over the region in a narrow window around midday and early afternoon. Several independent studies, including one by scientists at the Indian Space Research Organisation (ISRO), have found that farmers in Punjab and Haryana now set most of their paddy stubble alight later in the afternoon, after those satellites have gone by.
Jethva's figure is an estimate, not an official count, and it compares two states with one. Still, it raises a question that matters far beyond Delhi's smog: how far can governments rely on satellites to police farming when farmers know when the satellite passes?
How the 34,000 estimate was built
Jethva set out his numbers in a post on X on 9 November, which the Bombay Samachar reproduced on 10 November. He counted 4,089 fires detected by the VIIRS sensor on NOAA-20, which sees the ground at a resolution of 375 metres and passes near 1:30 pm local time, and 4,196 fires detected by the MODIS sensor on NASA's Aqua satellite, which has a coarser 1-kilometre view and now passes near 4 pm. He then scaled the later, coarser MODIS detections to the finer VIIRS baseline. "After empirical adjustment to VIIRS 375 m fire-count baseline, the total reaches to ~34,000 fires," he wrote, calling it a conservative estimate.
On 5 November he had told NDTV that his assessment found about 27,000 fires in Punjab between 1 October and 5 November, the Bombay Samachar and WION reported. The figure is his own estimate, not a NASA product; his paper on the subject says he pursued the work independently.
The official count comes from the Commission for Air Quality Management (CAQM), the federal body that oversees air quality in and around the National Capital Region. Its figures, reported by the Press Trust of India and Business Today on 9 November and by WION on 11 November, showed 4,459 stubble-burning incidents in Punjab from 15 September to 8 November, led by Tarn Taran district with 654, Ferozepur with 592 and Sangrur with 488. Inspections at 2,998 locations had confirmed burning at 1,310 sites.
The two numbers should not be set side by side without care. The official figure covers Punjab only and ends a day earlier; Jethva's covers Punjab and Haryana. The official count also comes from a fixed protocol that ISRO developed for the government, while Jethva's is a researcher's adjustment of one sensor's count to another's scale. Several outlets headlined the difference as "nearly eight times", which is the ratio of 34,000 to 4,459; the like-for-like gap for Punjab alone is not known from the published figures. None of the reports this desk could read by 11 November carried an official response to the estimate.
Diwali's spike and a season that is not over
The debate arrived in a week when the official numbers themselves jumped. On 8 November, the day of Diwali, Punjab recorded 1,152 new farm fires, the largest single-day rise of the season, taking its cumulative count from 3,307 to 4,459, according to official data reported by the Press Trust of India. On the same date in 2025 the count stood at 3,622, and the 2025 season ended with 5,114 fires by 30 November.
Even that comparison needs care. Diwali fell on 20 October in 2025, when about 32 per cent of Punjab's paddy had been harvested; by 8 November this year about 92 per cent had. The CAQM said it was concerned about the "very high" number of fires and met officials and police from 12 districts to press for stricter monitoring, Business Today reported.
This site reported on 9 November that Delhi's air quality index had reached 376. Punjab's monitoring season runs until the end of November, so neither count is final.
Why the time of day decides what a satellite sees
The satellites behind most of the world's fire maps fly in sun-synchronous polar orbits. They cross a given place at roughly the same local time every day, which makes their records consistent over decades but blind to whatever happens at other hours. NASA's Terra satellite passes in the late morning, and Aqua and the VIIRS instruments on the NOAA-20 and NOAA-21 satellites in the early afternoon. India's official system, as described by the Delhi think tank iFOREST in December 2025, relies on MODIS and VIIRS passes between about 10:30 am and 1:30 pm.
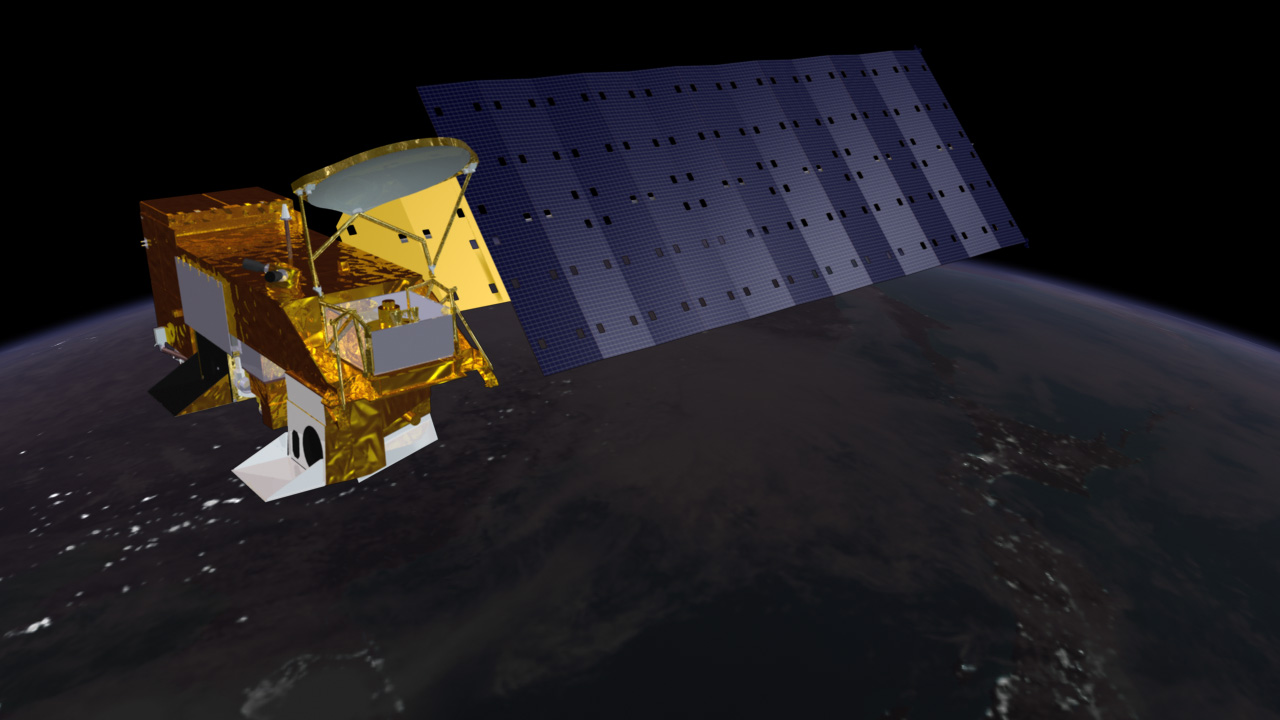
For two decades that window worked in Punjab, because farmers burned around midday. Jethva's own earlier research found that between 2002 and 2016 the post-monsoon fire count seen by Aqua-MODIS rose by about 60 per cent, in step with a 25 per cent rise in rice production and a 43 per cent rise in aerosol over the Indo-Gangetic Plain. Fire counts tracked crop growth so closely that he built a model predicting the season's fires from the greenness of the fields before harvest.
From 2022 that model broke. In a peer-reviewed paper, "Timing the Flames", published in the journal Remote Sensing on 11 May 2026 (DOI 10.3390/rs18101506), Jethva reported that seasonal fire counts from Aqua-MODIS in 2022, 2023, 2024 and 2025 were 20, 39, 67 and 71 per cent lower than the 2016-2021 average. His model overestimated the fires by 19, 68, 222 and 233 per cent in those years. Yet aerosol loading over the plain kept rising over the same period. The paper calls that combination "contradictory and counterintuitive": fewer fires and more smoke only fit together if the fires were still there and the satellites were not seeing them.
What the geostationary satellites show
To check, Jethva turned to GEO-KOMPSAT-2A (GK2A), a South Korean weather satellite that the Korea Meteorological Administration has operated since July 2019 from a fixed point above the equator at 128.2 degrees east. A geostationary satellite stares at the same half of the Earth all day; GK2A's Advanced Meteorological Imager scans its full disc every 10 minutes. Jethva designed a fire-detection method that compares the 3.8-micrometre infrared channel, which is sensitive to heat from flames, with the 11.2-micrometre channel, and applied it to the seven seasons from 2019 to 2025.
The result, in his words, "unambiguously shows a gradual shift in stubble burning activity toward the late afternoon hours beginning in 2022." Peak burning moved from around 1 to 2 pm to about an hour later in 2022 and 2023, and to between 4 and 5 pm in 2024 and 2025. In Punjab, GK2A's count of fire hotspots between noon and 6 pm rose from about 6,000 in 2019 to about 18,000 in 2021, fell by about 49 per cent in 2024 compared with 2021, and rose again by about 45 per cent in 2025.
Comparing year-on-year trends, Jethva roughly estimated that VIIRS missed about 64 per cent of fires in 2025 and MODIS about 40 per cent; for 2024 his figures were 56 and 32 per cent. MODIS misses fewer because Aqua has been drifting. Since July 2021 the ageing satellite has been allowed to drift in orbit, and its average pass over northwest India moved from 1:44 pm in the 2021 burning season to 3:12 pm in 2025, with about 3:50 pm expected by August 2026. That drift lets MODIS catch some of the later fires; this is why Jethva scaled its count to estimate the 2026 total.
The paper is explicit about its limits. GK2A sees northwest India at a slant, so each pixel there covers about 4 kilometres, too coarse to count individual small fires, and the method is a research algorithm rather than an official product. Some false detections remain possible, and clouds interfere in some years. Jethva says his approach is designed to show when fires happen, not to replace an official count. The study had no external funding and he is its sole author.
Independent studies found the same shift
Jethva is not alone. Scientists at ISRO's Space Applications Centre in Ahmedabad, writing in Current Science on 25 November 2025, used the European Meteosat Second Generation satellites, whose SEVIRI imager records fires every 15 minutes. Studying 15 October to 30 November in each year from 2020 to 2024, they found that fires in 2020 typically began around noon, peaked near 1:30 pm and died down by 3:30 pm; by 2024 the peak had moved to about 5 pm. The Tribune reported on 6 December 2025 that the study described the change as "an informed adjustment by farmers".
The same team had shown in June 2025 that India's own geostationary weather satellite, INSAT-3DS, can also detect the late-afternoon burning, and a January 2026 paper in Current Science used it to estimate how much energy the fires release.
iFOREST's Stubble Burning Status Report 2025, released on 8 December 2025, combined Meteosat data with burnt-area mapping from the European Sentinel-2 satellites. It found that more than 90 per cent of large farm fires in Punjab in 2024 and 2025 occurred after 3 pm, against 3 per cent in 2021. Official fire counts had fallen by more than 90 per cent since 2021, but the burnt area fell far more slowly: in Punjab from a peak of 31,447 square kilometres in 2022 to about 20,000 in 2025. "The result is a massive underestimation of fires, emissions and their contribution to air pollution in Delhi," Chandra Bhushan, iFOREST's chief executive, told The Tribune.
The courts have known about the problem for two years. At a hearing on 18 November 2024, the Supreme Court told the central government and the CAQM to arrange data from stationary satellites, "including the Korean satellite or others", so that farm fires could be tracked through the whole day, the legal news site The Legal Affair reported the next day. NASA's polar-orbiting data, the court noted, is limited to the 10:30 am and 1:30 pm passes.
The farm economics behind the fires
Burning has a reason. Since the Green Revolution, Punjab and Haryana have grown rice in the monsoon and wheat in winter. Punjab's rice output rose more than fifteen-fold, from under 1 million tonnes in the late 1960s to 12 to 14 million tonnes a year in 2016-2025, Jethva notes, citing the agriculture ministry's statistics portal. Combine harvesters, which spread as labour became expensive, leave long stubble standing, and the residue amounts to 1.5 to 2.25 times the grain. With only a few weeks between the paddy harvest and wheat sowing, and few affordable ways to clear the fields, a match is the cheapest tool a farmer has.
Penalties are real. The CAQM figures show compensation orders in 1,228 cases this season, and by 8 November police had registered 884 cases against farmers under the Bharatiya Nyaya Sanhita, India's criminal code, Business Today reported. Three separate satellite studies show that the burning itself has moved a few hours later in the day. The ISRO team called the shift "an informed adjustment by farmers"; the studies do not survey farmers about why. Whatever the reasons, the episode shows that a monitoring system people can predict is one they can work around.
A lesson for satellite monitoring everywhere
The finding matters well beyond Punjab. NASA's Fire Information for Resource Management System (FIRMS), which publishes MODIS and VIIRS fire detections worldwide within three hours of observation, is freely available to anyone, anywhere. Countries that use these counts to enforce burning bans, to report emissions or to forecast air quality all inherit the same blind spot if burning shifts outside the satellites' hours. Jethva's paper notes that regional air-quality forecasting models, which take in MODIS and VIIRS fire detections, have underestimated pollution in northwest India in recent seasons for this reason.
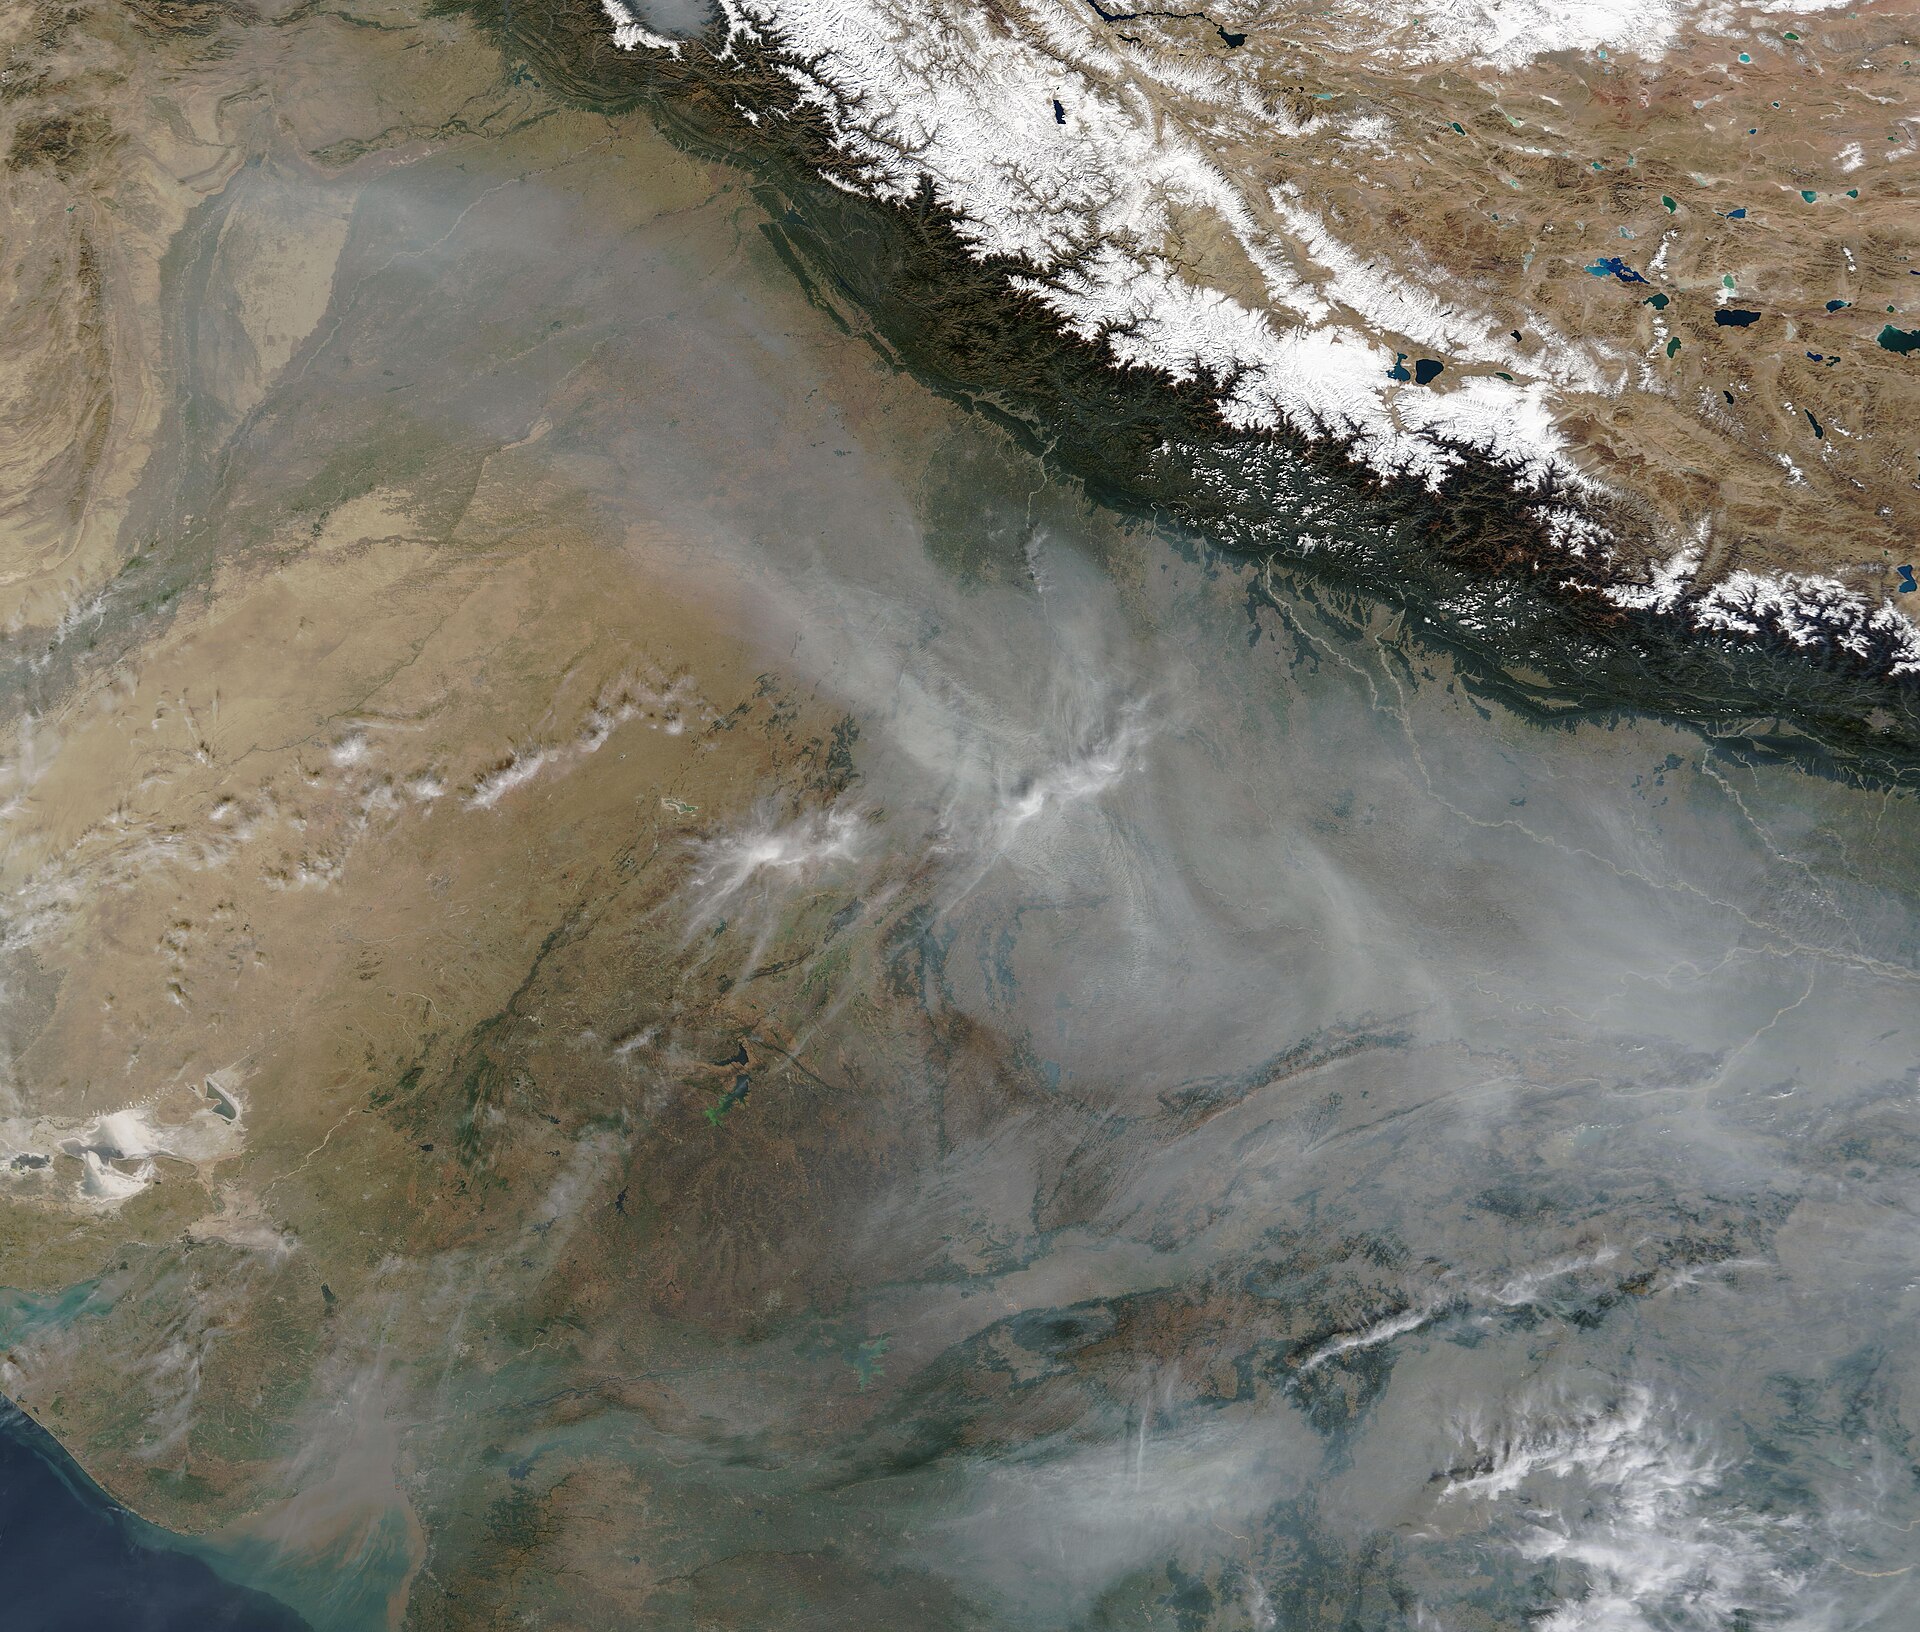
South Asia pays the highest price for getting it wrong. The World Bank's 2022 report Striving for Clean Air found that nearly 95 per cent of South Asians live where fine-particle pollution exceeds the World Health Organization's guideline. Citing the Health Effects Institute, it put the loss of life expectancy from outdoor fine particles at 1.87 years in Bangladesh, 1.56 years in Pakistan and 1.53 years in India. It lists open burning of agricultural residues among the sources of fine particles, proposes managing the Indo-Gangetic Plain as shared "airsheds", and finds that full cooperation between neighbouring states and countries is the cheapest way to save lives.
For farmers and regulators in other countries where crop residues are burned, the episode carries a practical message. Wherever satellites are used to enforce rules or to pay farmers, the people being watched will respond, and data systems need to be designed with that in mind.
Better tools exist, but each has limits
The technical fixes are known. Geostationary satellites see every few minutes but coarsely; polar satellites see finely but rarely. Combining them, as the ISRO team and iFOREST recommend, gives both timing and detail. Burnt-area mapping from Sentinel-2, at 10 metres, and Landsat 8 and 9, at 30 metres, measures the scar a fire leaves whenever it burned. Jethva suggests his method could be applied to INSAT-3DS and extended to Uttar Pradesh, Madhya Pradesh, Bihar and other states where crop fires are also recorded.
None of these is perfect. Coarse geostationary pixels can merge several small fires into one or miss a small one, cloud and haze can hide burn scars, and Jethva himself says his geostationary counts are for trends and timing, not an exact tally.
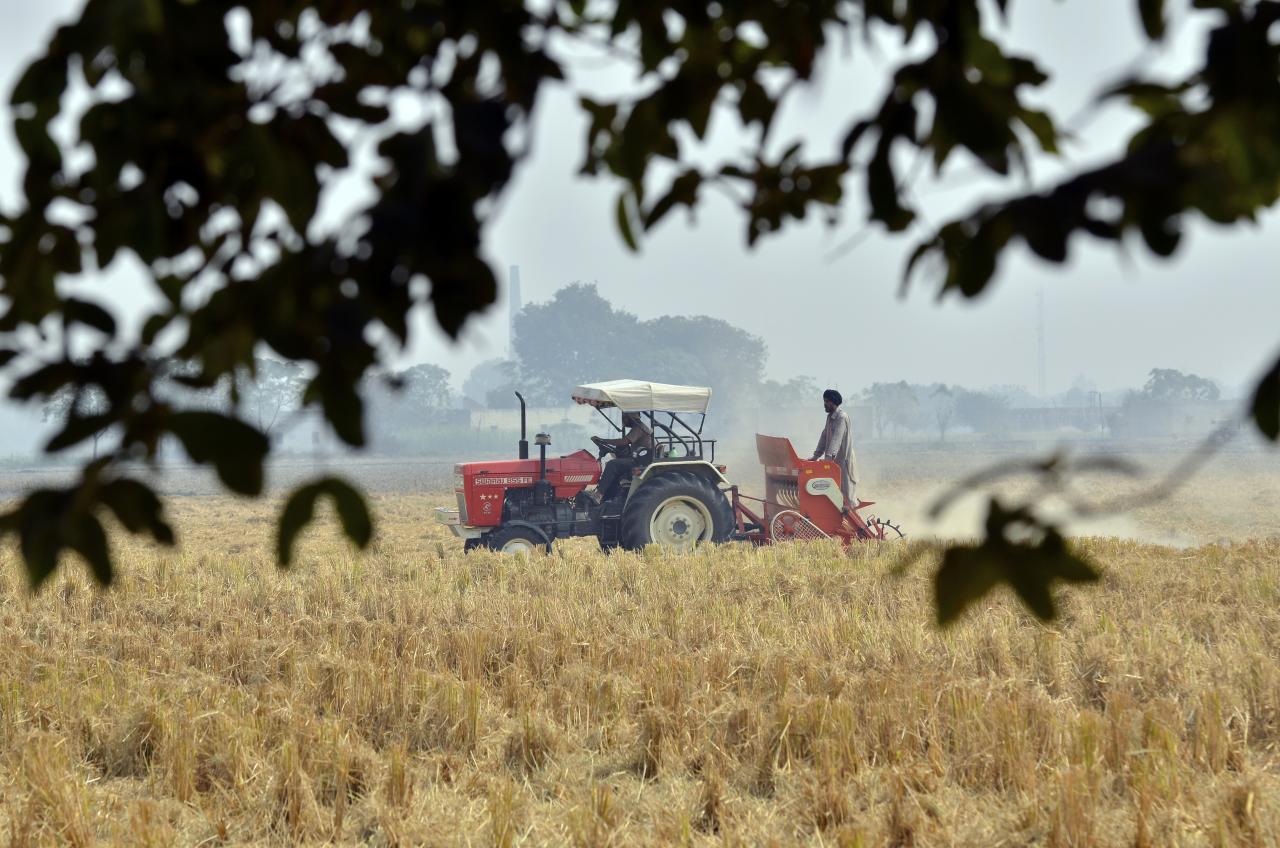
The more durable answer lies on the ground. The tractor-drawn Happy Seeder, which sows wheat directly into standing rice stubble, was already working in fields near Sangrur in 2011, and balers that collect straw for power plants and industry are also promoted. Jethva's paper ends by calling for "an effective crop residue management system" to reduce burning and the pollution that follows. The satellites can show whether that is working; they cannot do the work.
Final counts are due after 30 November
The burning season has about three weeks to run. On Jethva's analysis, the drifting Aqua satellite should catch more late fires this year than before, so its count may rise even if burning does not. Whether the CAQM publishes burnt-area data beside the fire count, as iFOREST has urged, may decide whether this season's figures are trusted.
Why a fire count is only as good as the satellite's clock
The dispute over 34,000 fires is a lesson in what a measurement can tell. A count from a satellite that passes at 1:30 pm is an accurate count of the fires burning at 1:30 pm. When farmers change their habits, that count stops describing the season, and policy built on it rewards the change instead of the goal. India now has the science, from NASA researchers, ISRO and independent analysts, to see the fires at any hour. Using it would give farmers, regulators and the millions who breathe the smoke a more honest picture.
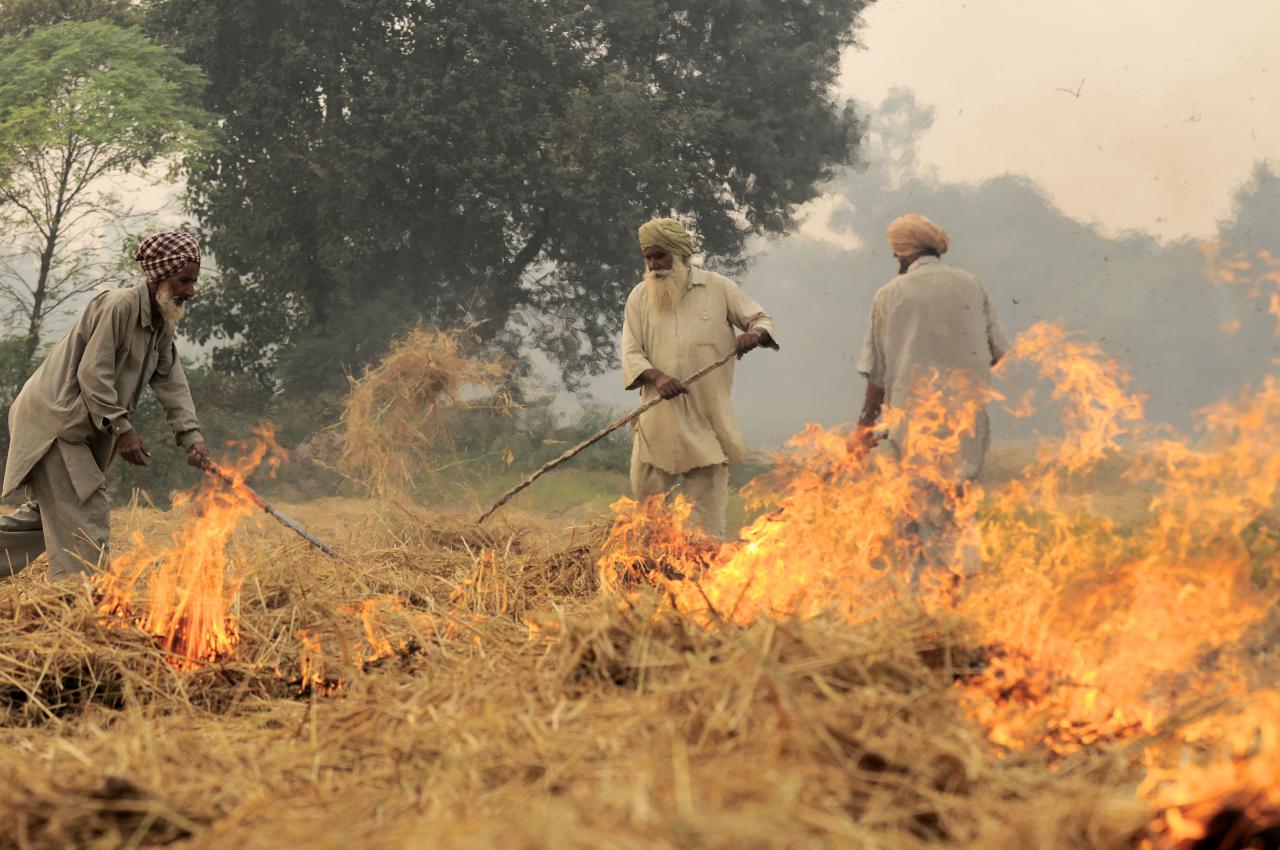
Photo: Neil Palmer, CIAT / Wikimedia Commons (CC BY-SA 2.0). The top picture shows rice residues burning in a harvested field in southeast Punjab, India, on 1 November 2011, before the wheat season, as background.

Comments
(0)