Alberta farmers and their agronomists have a new web-based tool for deciding when and how much to irrigate. Irrimap, developed by the Mueller Irrigation Research Group (MIRG) at Lethbridge Polytechnic with support from Agriculture and Agri-Food Canada and the Saskatchewan Ministry of Agriculture, estimates evapotranspiration at field scale from satellite data.
Evapotranspiration, or ET, is the water a field loses to evaporation from the soil plus transpiration through the pores of the plants. It is the number an irrigator most needs and least often has, because measuring it in the field is slow. "You can remotely locate information that's relevant to your question immediately and don't have to go out into the field to measure it yourself," said Michael Kehoe, a research scientist with MIRG.
A user outlines a field, enters planting and harvest dates and can view Landsat or Sentinel-2 imagery of it. Irrimap then plots ET for the area, showing the 95th percentile, the mean, the 5th percentile and a forecast, so the grower can see whether the crop is losing more or less water than the range for that stage.
"We're taking a picture of a field and we're figuring out how much of that field is plant matter and how much the plant is losing in water," said Derian Setoguchi, the research assistant who coded the map. Open-source weather data gives the theoretical water loss, and multiplying by the NDVI biomass value gives the field's actual loss.
An online manual walks users through the map and its tools. Diego Flammini reported the story for Farms.com.
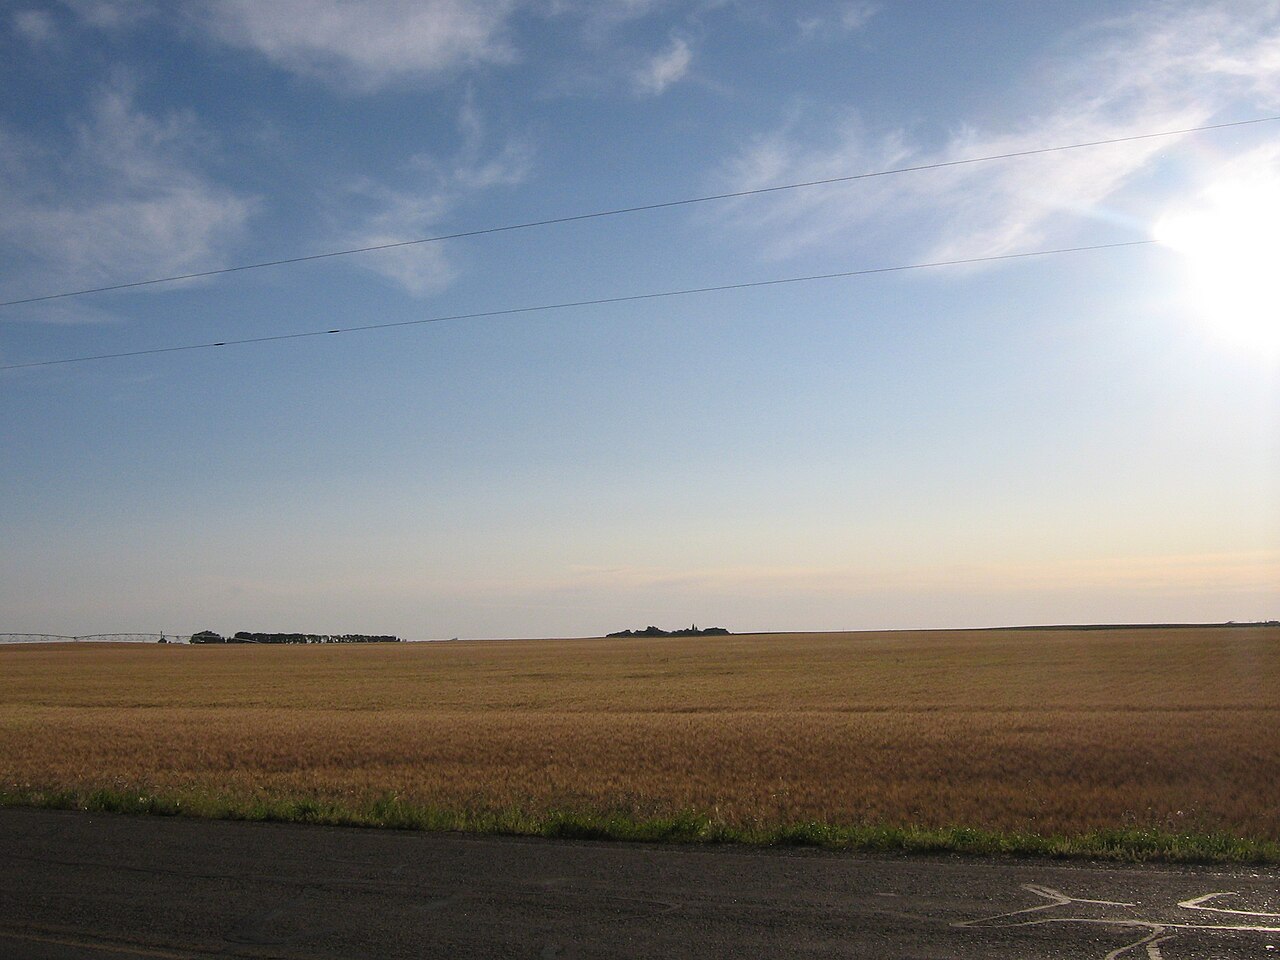
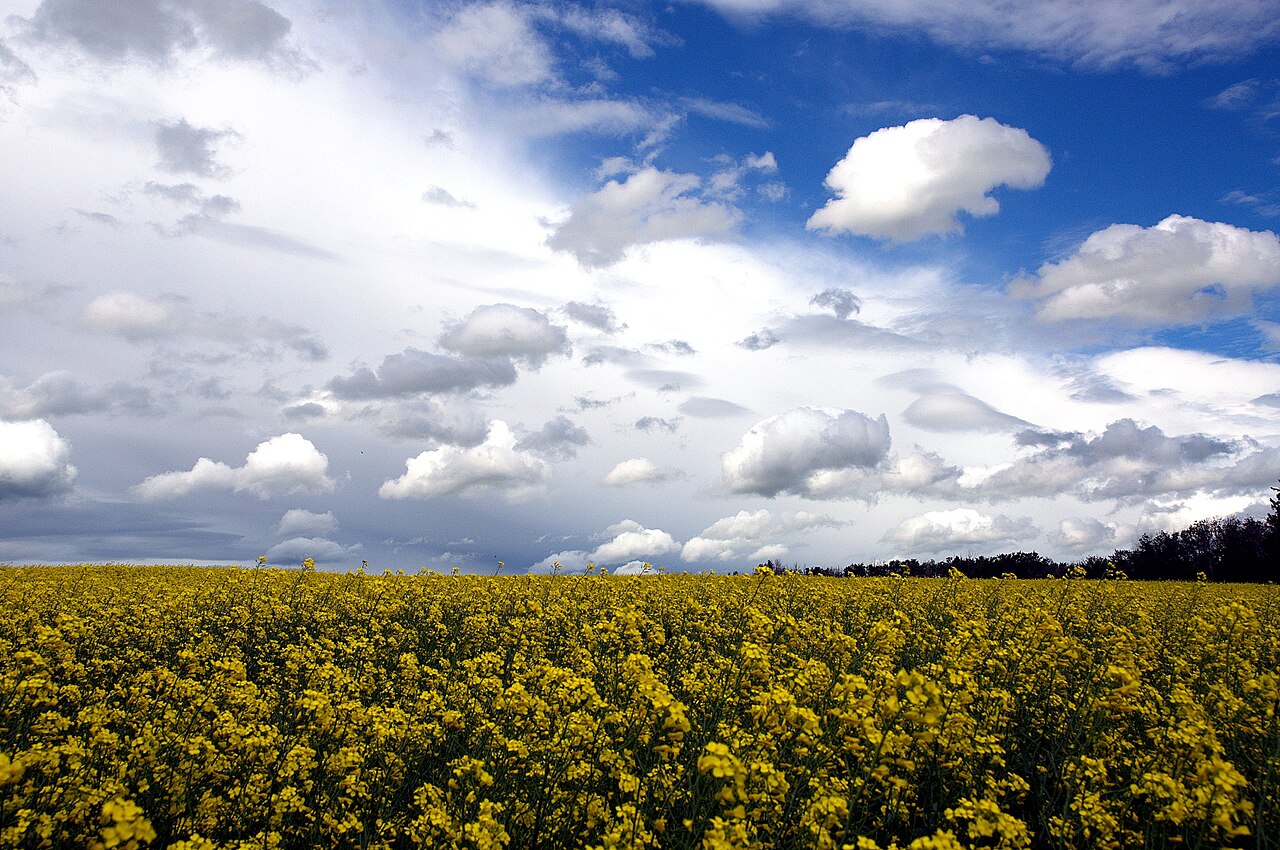
Photo: dave_7 / Wikimedia Commons (CC BY-SA 2.0)
Source: Farms.com
Comments
(0)