
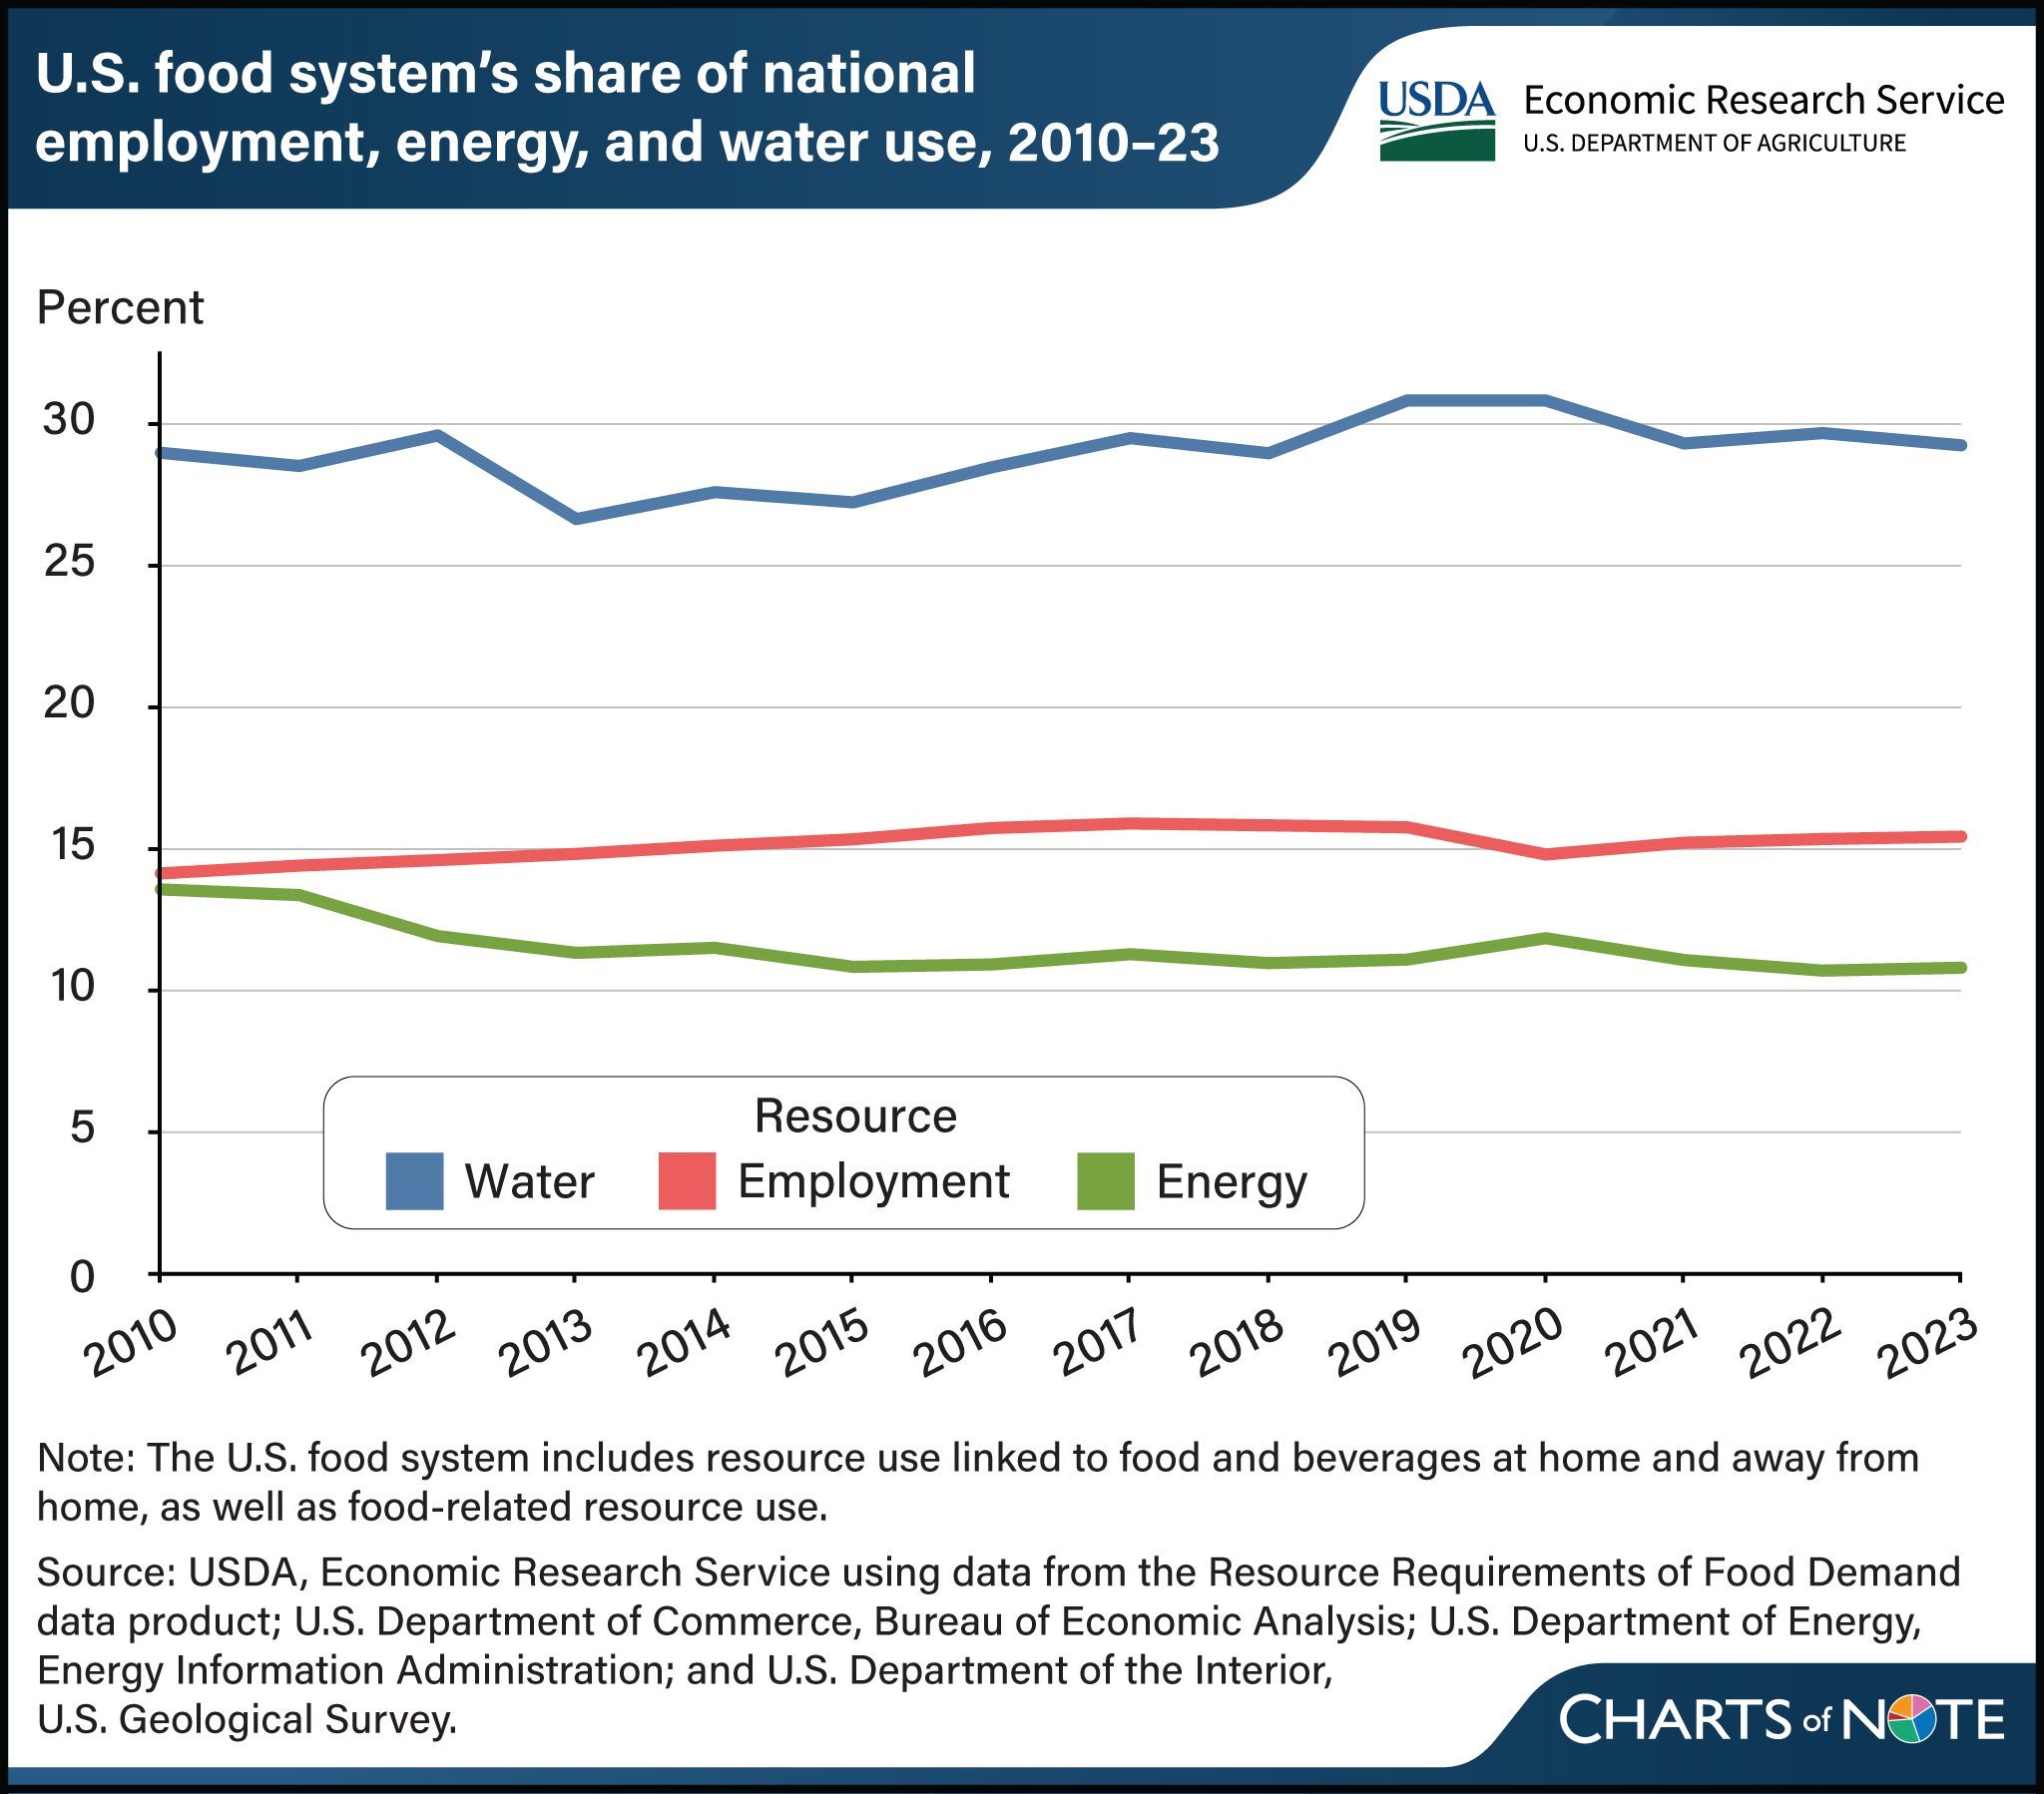
The US food system, from farm inputs to households, used more than a quarter of the country's freshwater every year from 2010 to 2023, a far larger share than it took of the nation's jobs or energy, according to a Chart of Note from the USDA Economic Research Service (ERS).
In 2023 the food system relied on 27.7 trillion gallons of freshwater, 29.3 percent of total US freshwater withdrawals. Water was not only the resource with the highest share but also the most variable over the period, ranging from 26.7 to 30.9 percent of the national total.
Labour and energy shares were lower. The food system employed 25 million workers in 2023, or 15.5 percent of the US workforce, and used 10.8 percent of all energy consumed in the United States, about half of it in the form of electricity.
The estimates come from Resource Requirements of Food Demand (RRFD), a data product ERS launched recently and discussed in a recorded webinar. RRFD measures resource use across the whole food system, from the inputs used on farms to households, and includes the resources used to market and transport imported food and beverages. The chart draws on the RRFD data as updated in March 2026.
For farmers and food businesses, the figures put water at the centre of the food system's resource footprint: it is the input whose share of the national total is both the largest and the least stable from year to year, while the food system's claim on jobs and energy is smaller and steadier.
The chart is by Sarah Rehkamp and Wilson Sinclair of ERS.
Source: USDA Economic Research Service

Comments
(0)