
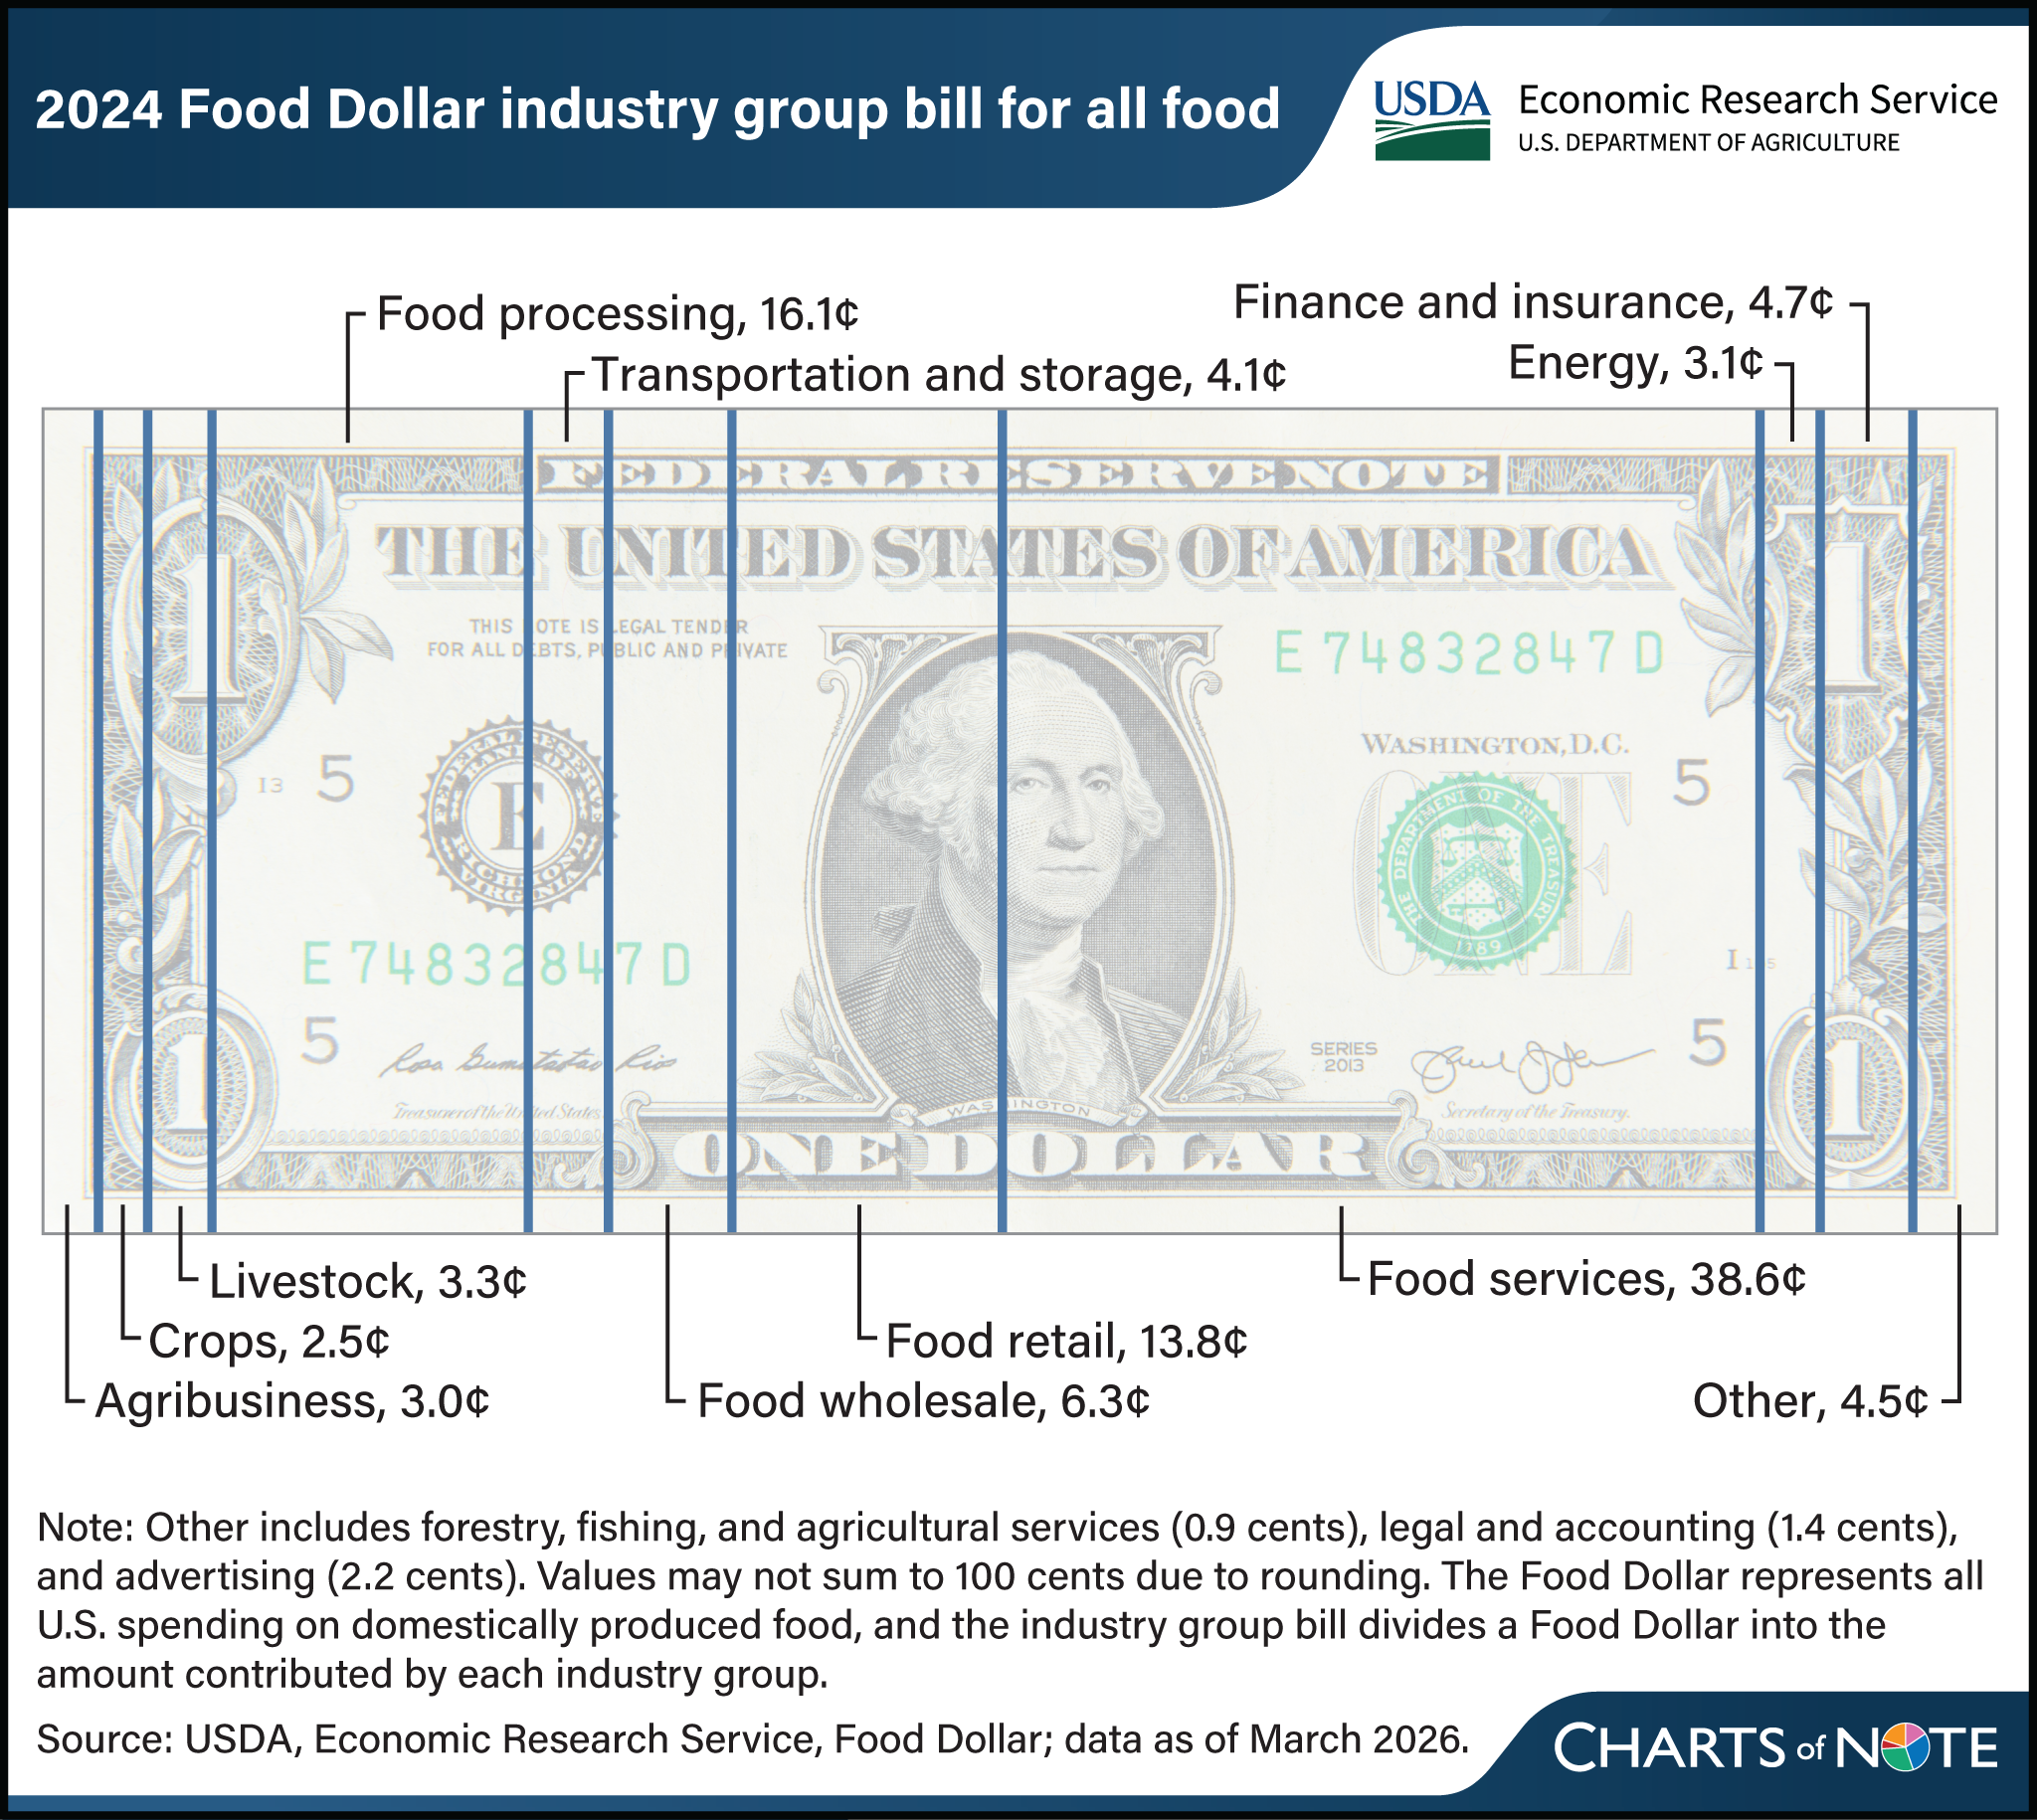
Of every dollar Americans spent on food grown in their own country in 2024, 6.7 cents was value added on the farm, according to a Chart of Note from USDA's Economic Research Service (ERS) based on its revised Food Dollar series.
Livestock contributed the largest part of that farm value, at 3.3 cents. Crops added 2.5 cents, and forestry, fishing and agricultural services added 0.9 cents.
ERS reports these shares in what it calls the Food Dollar industry group bill. They are net proceeds: the amount each industry group keeps after deducting the expenses it pays to other industry groups. A crop farm's share, for instance, is what remains after it has paid for fertilizer, fuel, machinery and other inputs supplied from outside farming.
The shares depend on factors such as the mix and prices of the commodities used in production, as well as the mix of foods in consumer spending, the agency says.
ERS updated the Food Dollar in 2026 using a new model. Compared with the previous version, the new model splits farm production into three industry groups, giving a more detailed view of how farming contributes to the domestic value chains that produce the food consumers buy at grocery stores and restaurants. Because of the change, the results are not directly comparable with earlier releases.
For farmers the figure is a sober measure of where the money in food goes: for every dollar at the checkout or the restaurant table, less than 7 cents is value created on the farm, with the rest earned in processing, distribution, retail and food service. The data are in the ERS Food Dollar data product, updated on March 10, 2026. The chart was prepared by ERS economists James Chandler Zachary and Quinton Baker.
Source: USDA Economic Research Service

Comments
(0)