
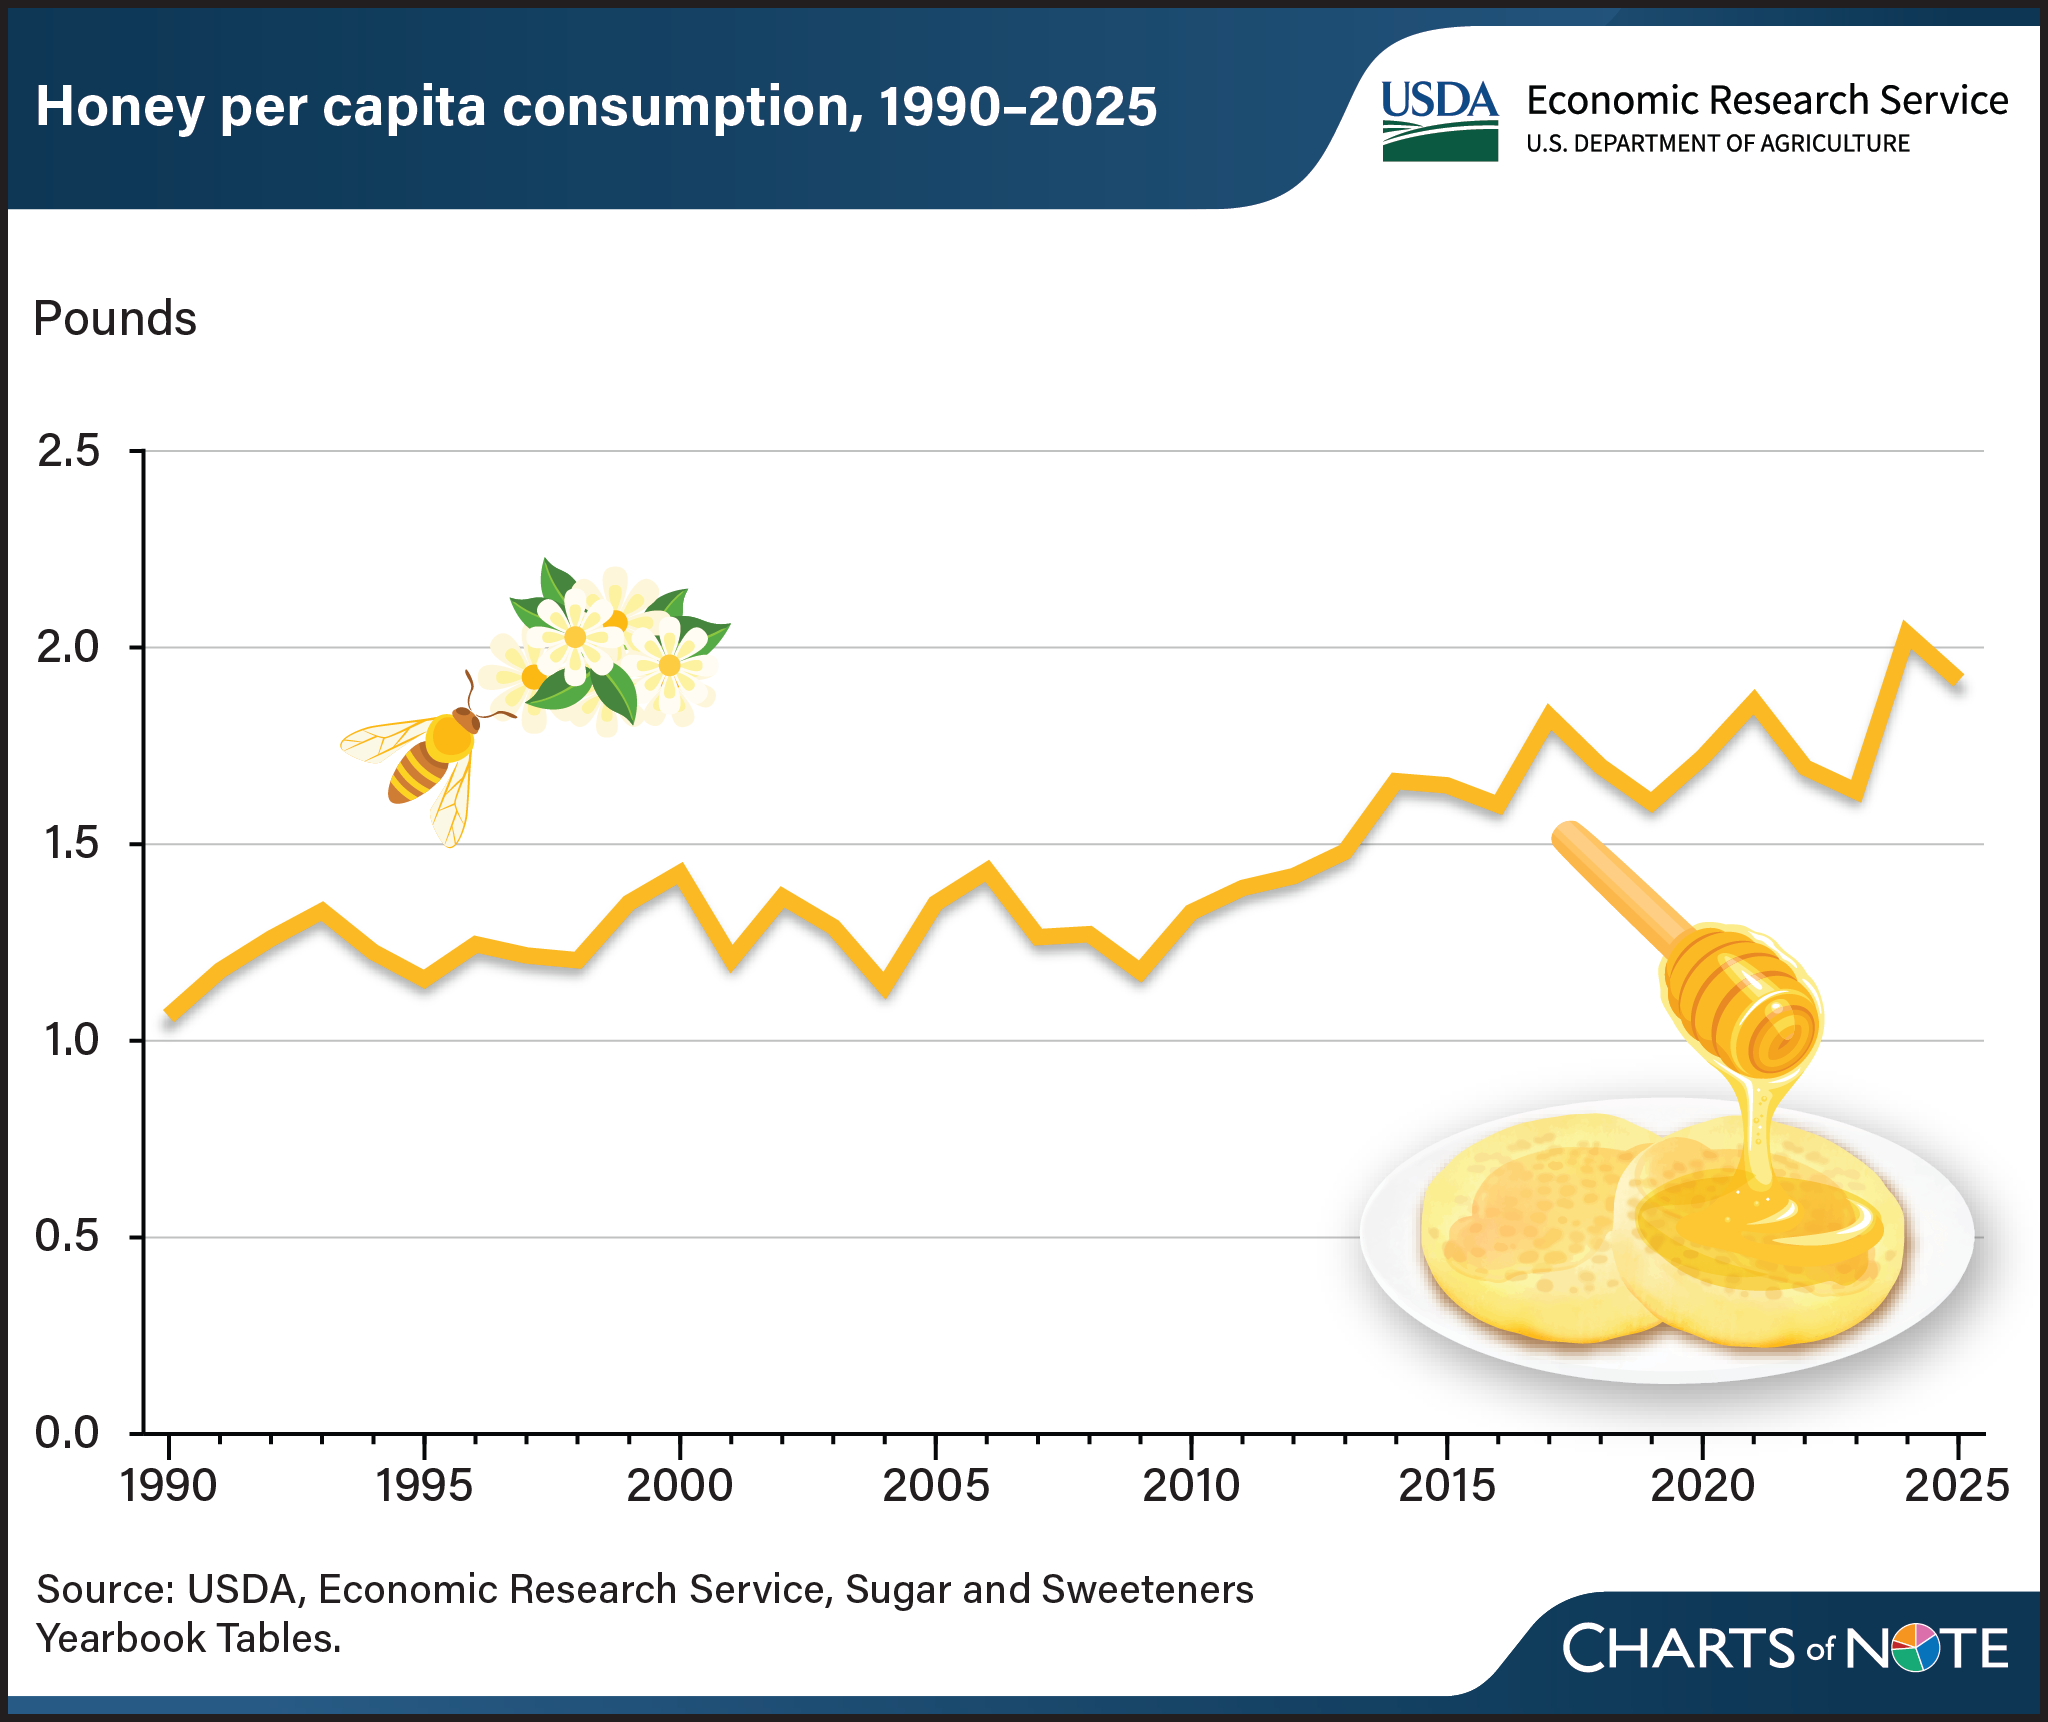
Americans are eating roughly twice as much honey as they did a generation ago, and most of it now arrives from other countries, according to USDA's Economic Research Service.
In 1990 the average United States consumer used scarcely more than a pound of honey a year. By 2025 per capita consumption had nearly doubled to about 1.9 pounds, following a record 2.0 pounds in 2024.
ERS attributes the rise to two things working together: a larger population, and each person eating more. Both push demand in the same direction, and domestic production has not followed.
Imports have filled the gap. In 2025, 78 percent of the United States honey supply came from imported sources — most often from India, Argentina, Brazil and Vietnam.
That figure is the one worth dwelling on for beekeepers elsewhere. One of the largest honey markets in the world now buys more than three-quarters of what it consumes abroad, and the four countries named are all exporters with substantial smallholder beekeeping sectors.
The trend also carries a caution about price. A market supplied overwhelmingly by imports is one where what an exporting country's beekeepers receive is set by competition among suppliers, not by the strength of American demand alone.
The figures come from the ERS Sugar and Sweetener Yearbook Tables, compiled by Vidalina Abadam, D. Adeline Yeh and Simla Tokgoz, with a fuller treatment in the June 2026 Sugar and Sweetener Outlook.
Source: USDA Economic Research Service

Comments
(0)